
All explainers · Reading a transit network
Looking inside the line, not only at total demand
Animation paused (reduced motion). Press play to watch.
In one sentence
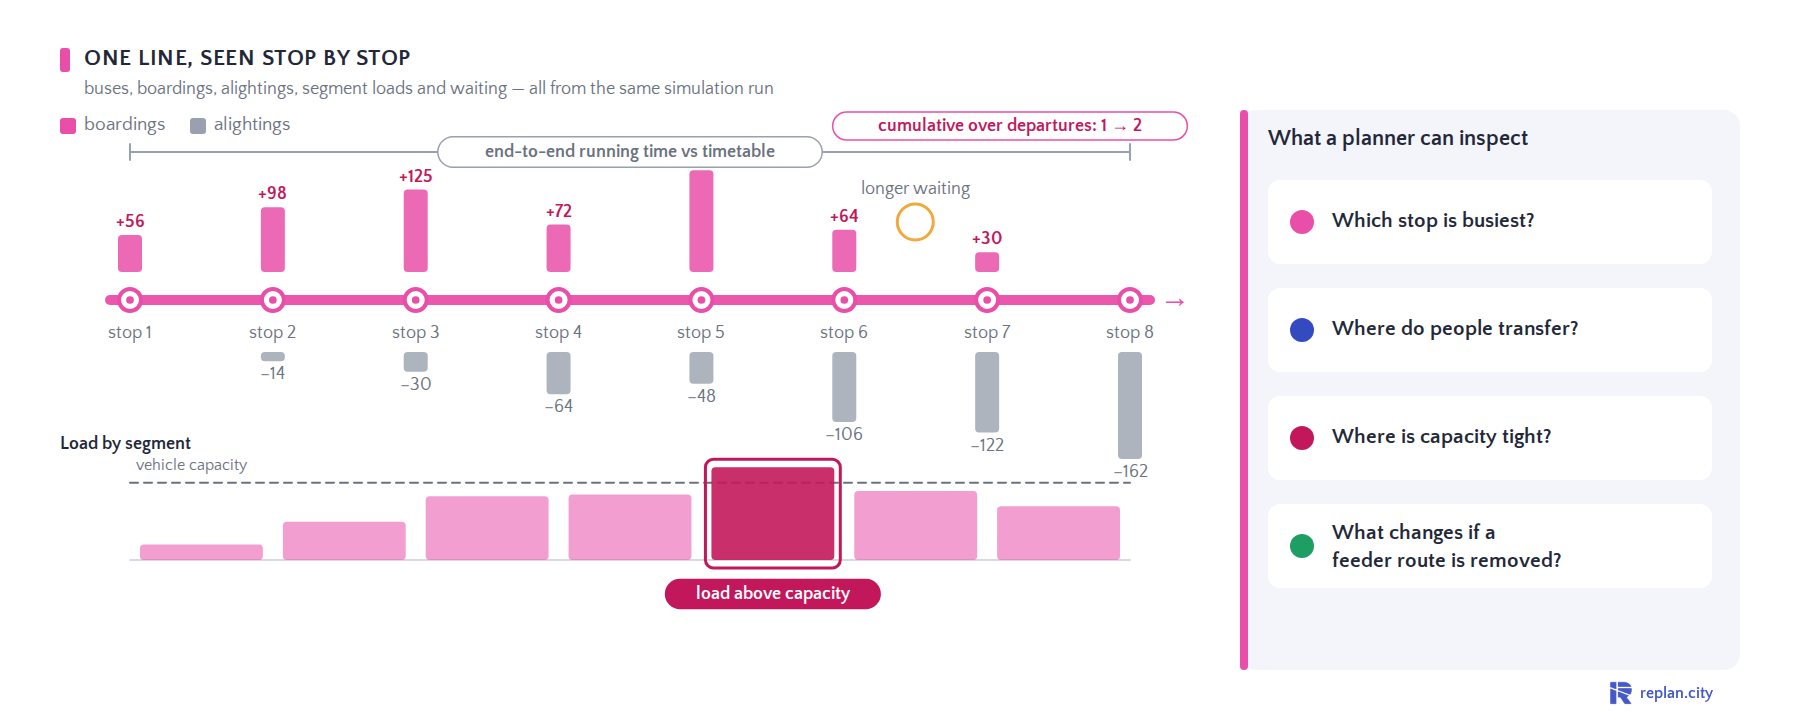
Buses, boardings, alightings, segment loads and waiting — all from the same simulation run.
Why it matters
One line as the simulation sees it: boardings and alightings appear stop by stop as vehicles pass and accumulate over departures; the load profile shows where the vehicle fills and where it exceeds capacity; waiting and running time against the timetable are read from the same run. The clip ends on the departures and vehicle blocks of the line in Replan.City.
A network is more than its total demand: where the vehicle fills, where people wait, where a feeder change shifts transfers. Reading a line stop by stop, from one simulation run, is the difference between a forecast and a planning tool.
Sources
- Schematic illustration; values are illustrative
- Final frame: Replan.City, Pink BRT project workspace
What you see
- 00.0Stops, boardings, alightings
- 05.0Second departure: cumulative counts
- 08.5Load by segment, capacity
- 11.0Waiting and running time
- 13.0Questions a planner can ask
- 16.5Replan.City: departures and blocks
Use this explainer
MP4 (1800×720) · GIF (1200 px) · Poster (PNG)

Embed: <iframe src="https://www.replan.city/explains/embed/inside-the-line.html?lang=en" width="900" height="360" style="border:0;max-width:100%;aspect-ratio:5/2" loading="lazy" title="Looking inside the line, not only at total demand"></iframe>
Paste into any page; the explainer plays as live SVG (no video file).
Licence: CC BY 4.0 — reuse freely with the line “Replan GmbH · replan.city/explains”. The Replan mark in the corner stays.
See it on your own network
Book a demoRelated explainers
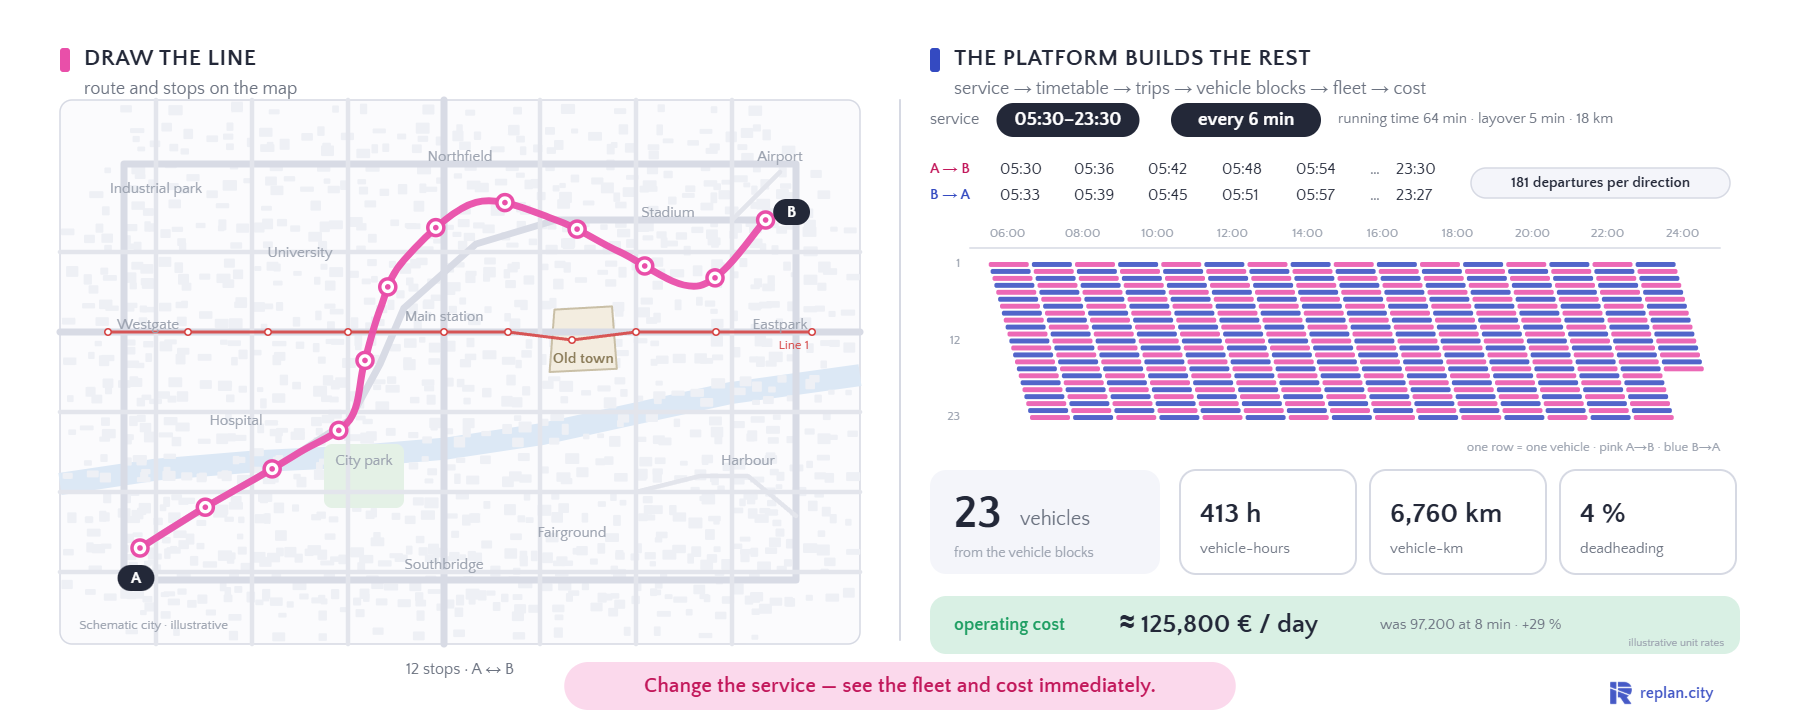
From a line sketch to buses and cost
Change the service — see the fleet and cost immediately.
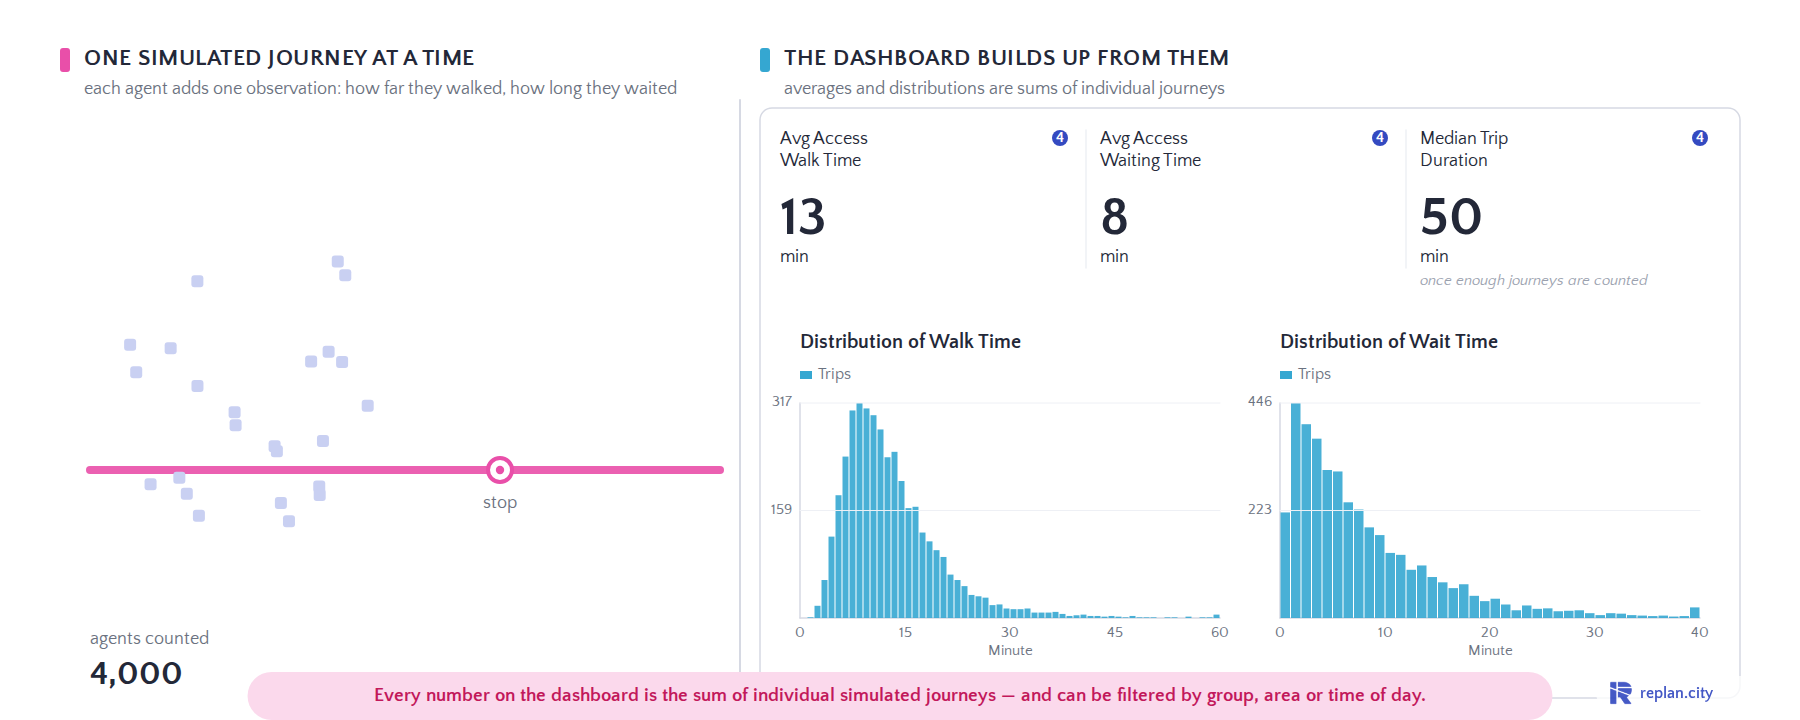
From individual journeys to dashboard statistics
Every number on the dashboard is the sum of individual simulated journeys — and can be filtered by group, area or time of day.
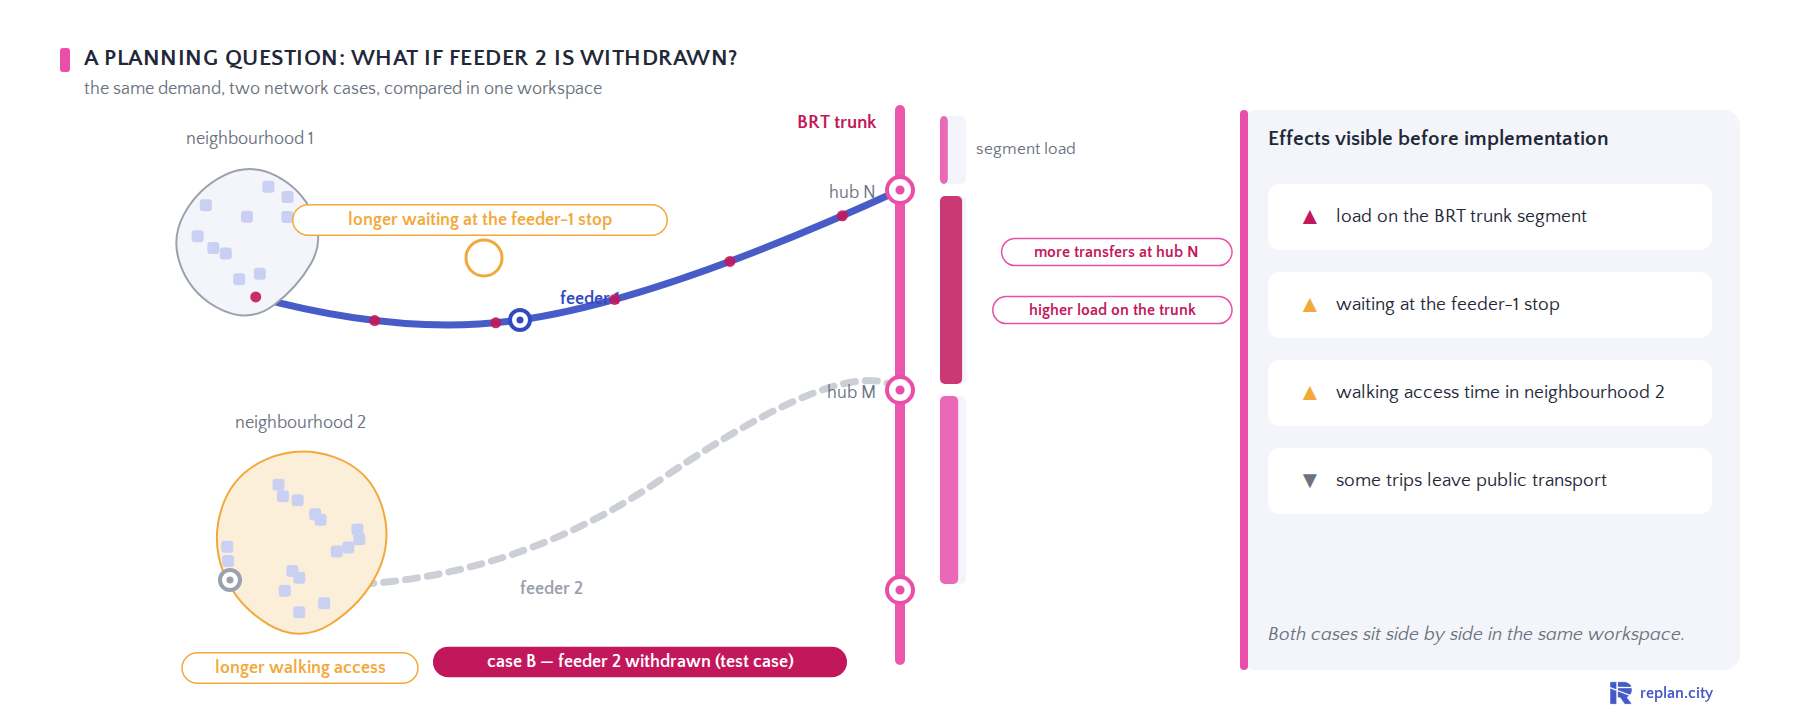
Testing a feeder change before implementation
Both cases sit side by side in the same workspace.