
All explainers · Reading a transit network
From individual journeys to dashboard statistics
Animation paused (reduced motion). Press play to watch.
In one sentence
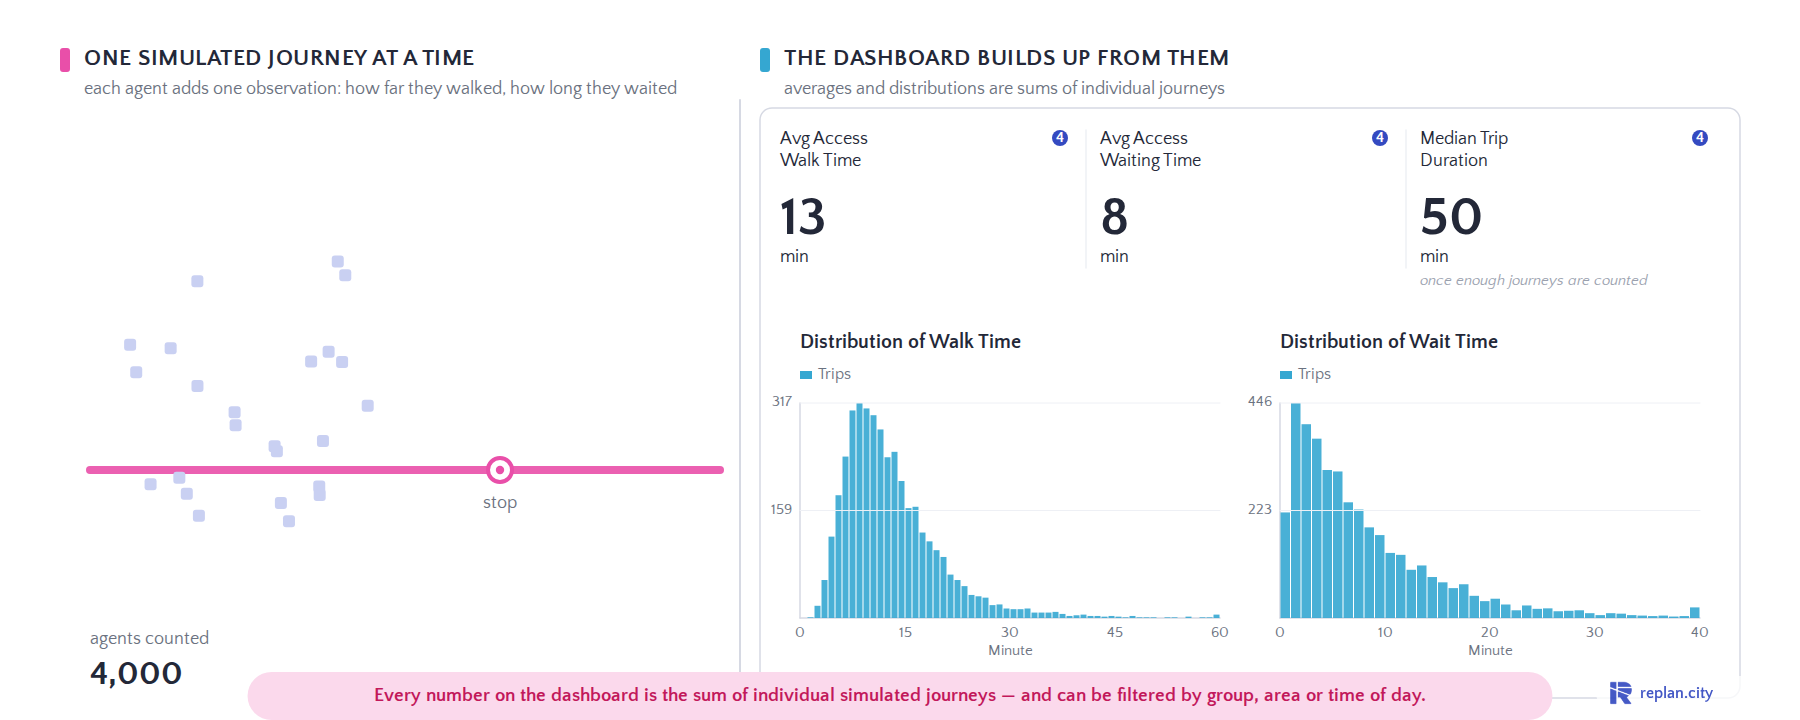
Every number on the dashboard is the sum of individual simulated journeys — and can be filtered by group, area or time of day.
Why it matters
One simulated traveller walks to the stop and waits: one observation — nine minutes of walking, four of waiting. It lands in the distributions and moves the averages; the next traveller adds another. After a few thousand journeys the distributions take their shape — the same shape as on the passenger-time dashboard in Replan.City.
A network is more than its total demand: where the vehicle fills, where people wait, where a feeder change shifts transfers. Reading a line stop by stop, from one simulation run, is the difference between a forecast and a planning tool.
Sources
- Schematic illustration; values are illustrative
- Final frame: Replan.City passenger-time dashboard, Pink BRT project
What you see
- 00.0One journey, one observation
- 03.0Distributions build up
- 10.0Averages settle
- 15.0Enough journeys counted
- 17.0Replan.City dashboard
Use this explainer
MP4 (1800×720) · GIF (1200 px) · Poster (PNG)

Embed: <iframe src="https://www.replan.city/explains/embed/journeys-to-dashboard.html?lang=en" width="900" height="360" style="border:0;max-width:100%;aspect-ratio:5/2" loading="lazy" title="From individual journeys to dashboard statistics"></iframe>
Paste into any page; the explainer plays as live SVG (no video file).
Licence: CC BY 4.0 — reuse freely with the line “Replan GmbH · replan.city/explains”. The Replan mark in the corner stays.
See it on your own network
Book a demoRelated explainers
Individual agents: groups and single persons
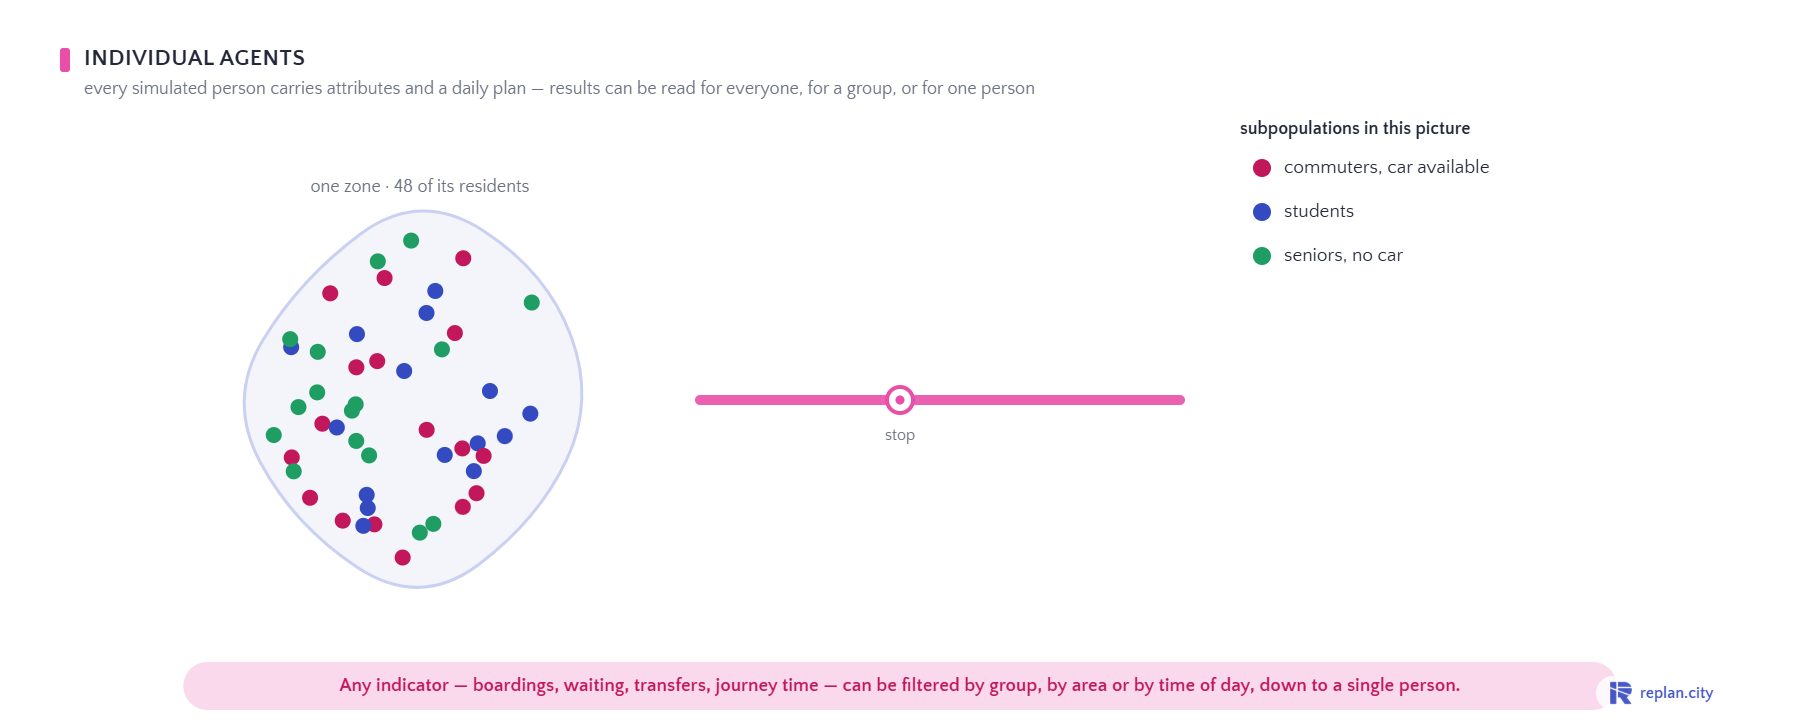
Any indicator can be filtered by group, by area or by time of day, down to a single person.
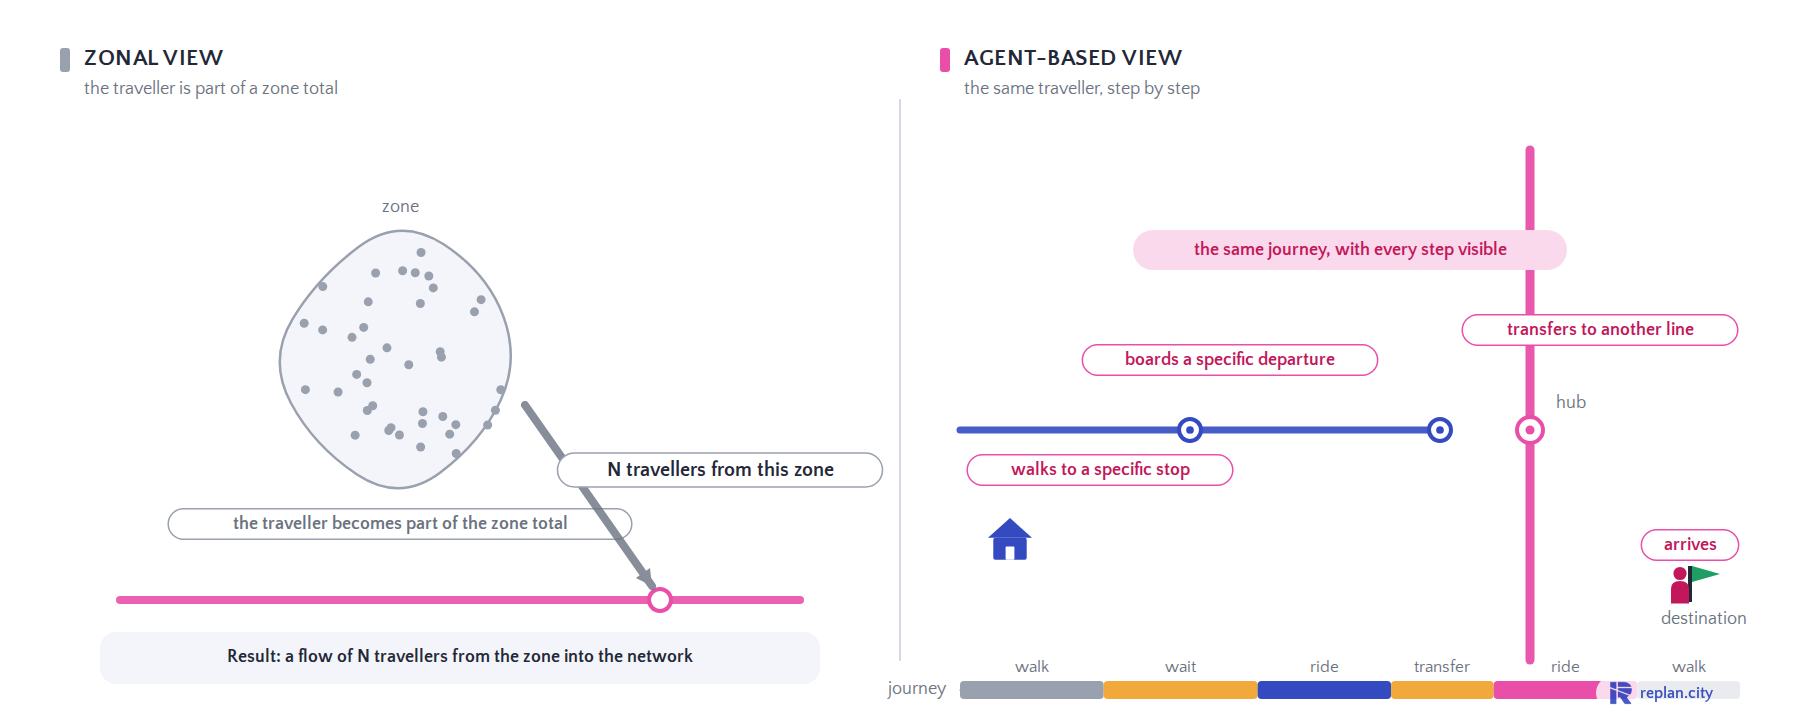
One traveller, two modelling views
Not a different answer to the strategic question — a visible journey behind the total.
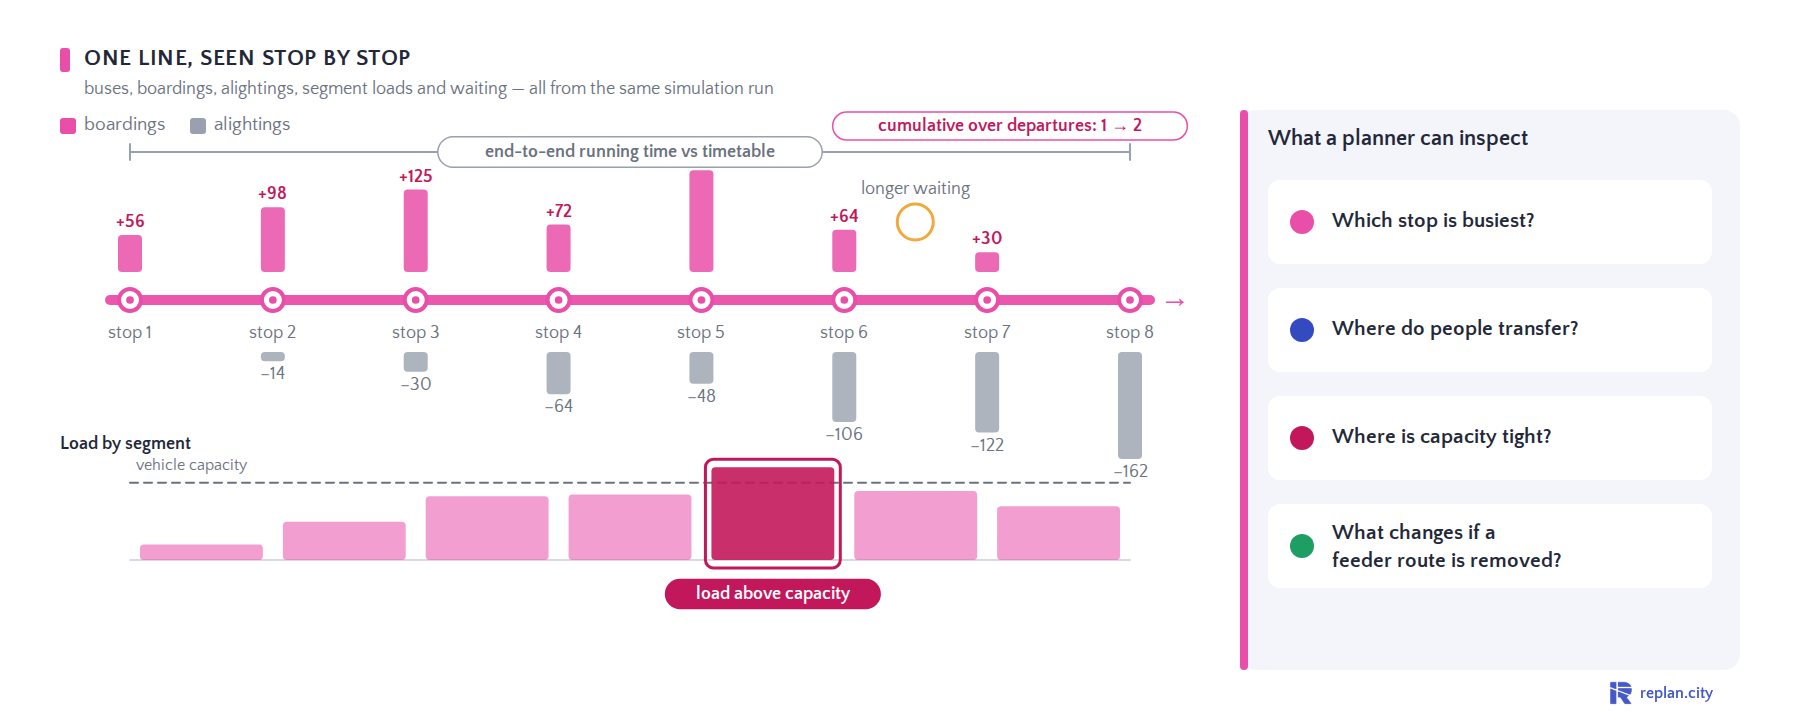
Looking inside the line, not only at total demand
Buses, boardings, alightings, segment loads and waiting — all from the same simulation run.