
All explainers · Reading a transit network
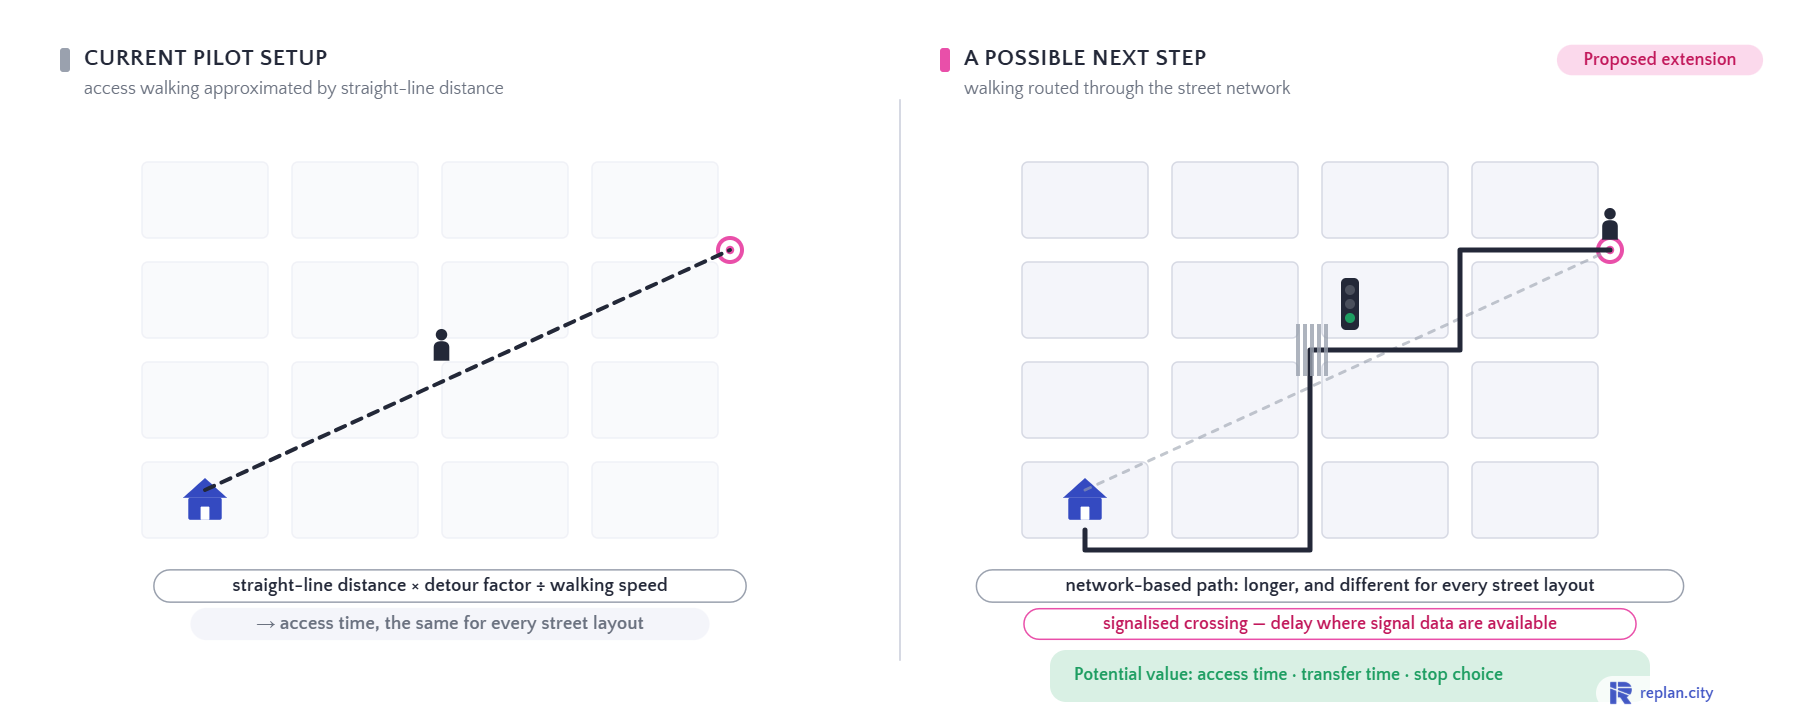
From straight-line walking to network-based walking
Animation paused (reduced motion). Press play to watch.
In one sentence
Potential value: access time, transfer time, stop choice.
Why it matters
In a simple setup, walking to a stop is straight-line distance × detour factor ÷ walking speed — the same for every street layout. Routed through the street network, the path follows the sidewalks, includes crossings and, where signal data exist, a delay at the signalised crossing. That changes access time, transfer time and sometimes the choice of stop.
A network is more than its total demand: where the vehicle fills, where people wait, where a feeder change shifts transfers. Reading a line stop by stop, from one simulation run, is the difference between a forecast and a planning tool.
Sources
- Schematic illustration; values are illustrative
What you see
- 00.0Straight-line access
- 05.0Network-based path
- 08.0Signalised crossing
- 11.0Potential value
Use this explainer
Poster (PNG) · MP4 / GIF: rendered on request
Embed: <iframe src="https://www.replan.city/explains/embed/network-based-walking.html?lang=en" width="900" height="360" style="border:0;max-width:100%;aspect-ratio:5/2" loading="lazy" title="From straight-line walking to network-based walking"></iframe>
Paste into any page; the explainer plays as live SVG (no video file).
Licence: CC BY 4.0 — reuse freely with the line “Replan GmbH · replan.city/explains”. The Replan mark in the corner stays.
See it on your own network
Book a demoRelated explainers
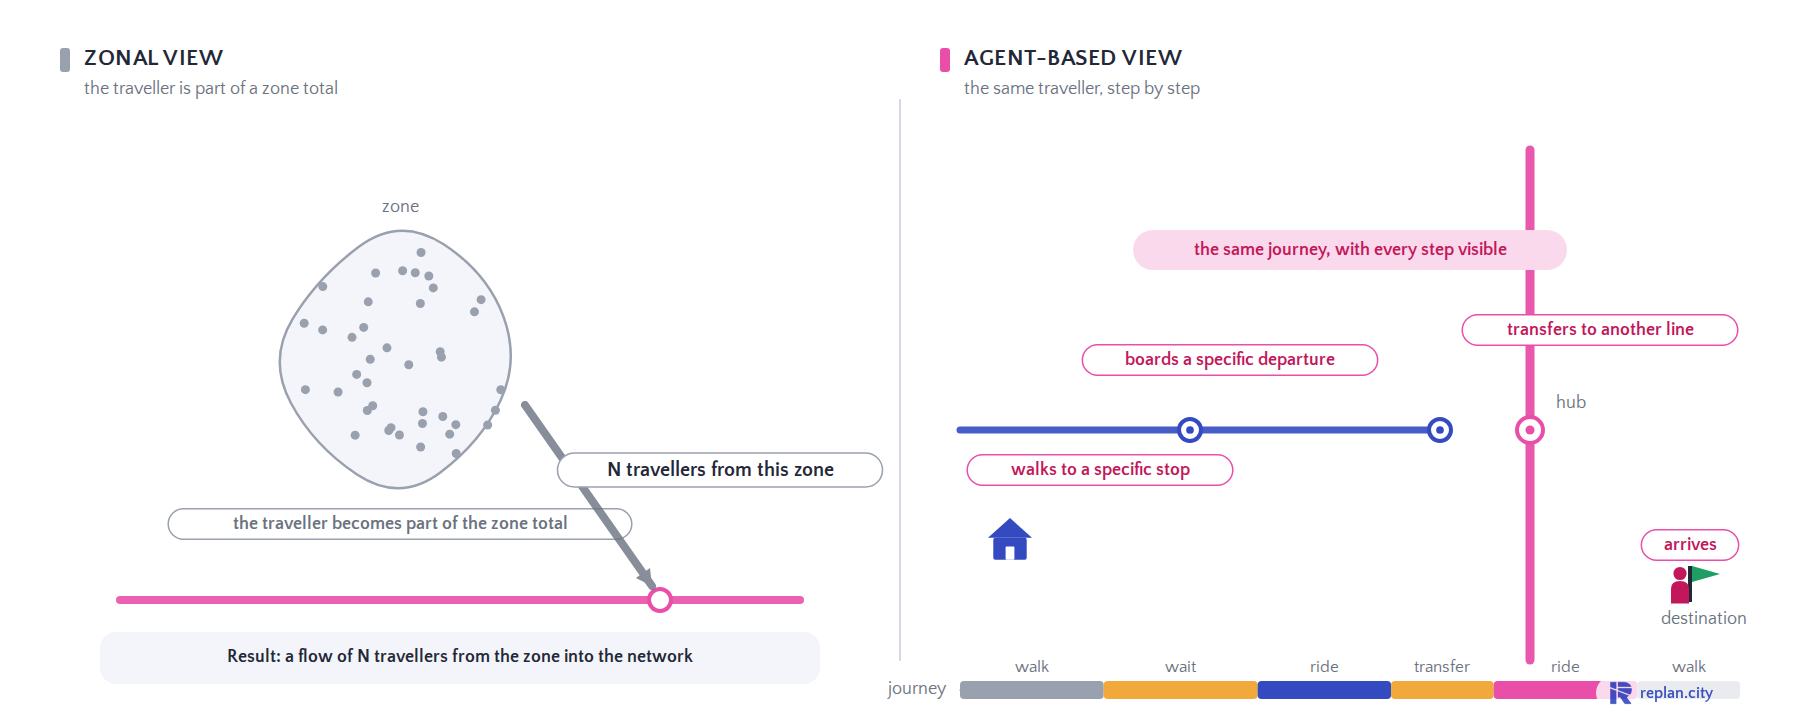
One traveller, two modelling views
Not a different answer to the strategic question — a visible journey behind the total.
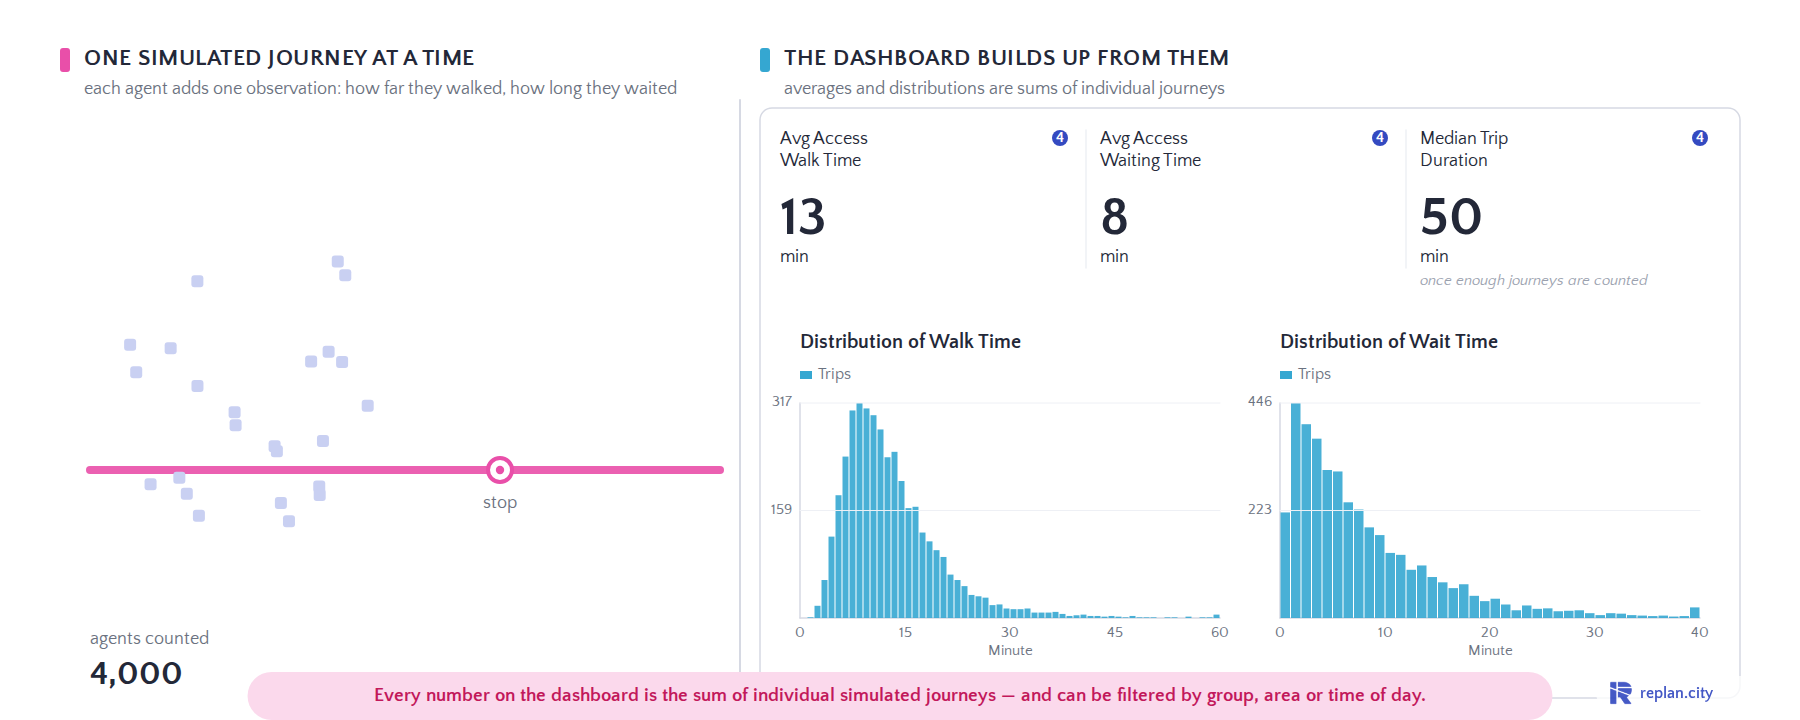
From individual journeys to dashboard statistics
Every number on the dashboard is the sum of individual simulated journeys — and can be filtered by group, area or time of day.
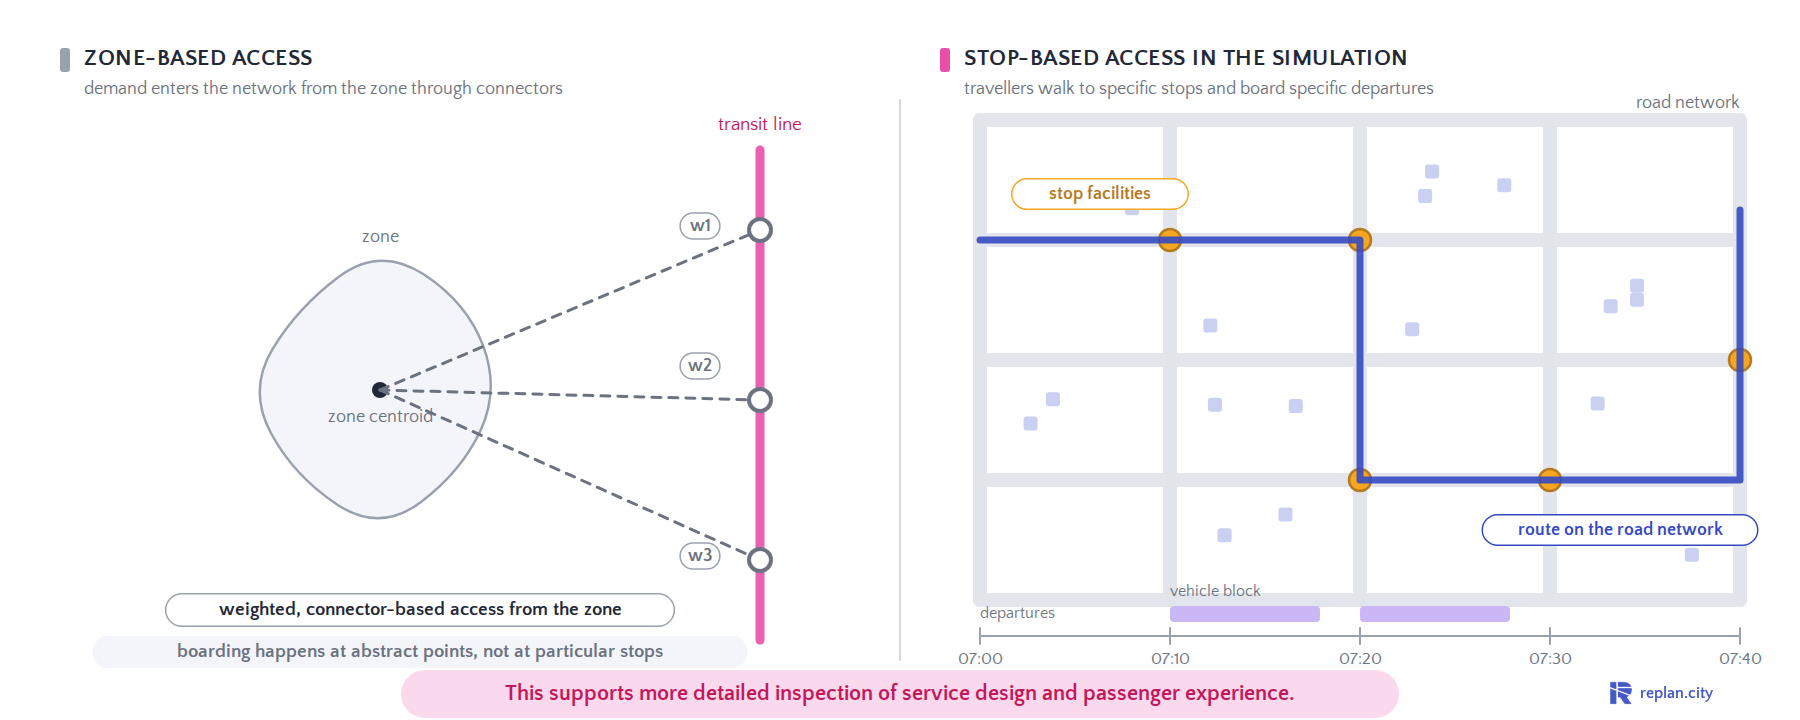
Two different ways to connect travellers to transit
This supports more detailed inspection of service design and passenger experience.