
Replan Explains
Transit planning concepts, one at a time, in about a minute.
Short, silent explainers on agent-based simulation and public transport planning — the kind you can drop into a lecture, a LinkedIn post or a project meeting. Built with the same visual language as the Replan platform. Free to reuse with attribution.
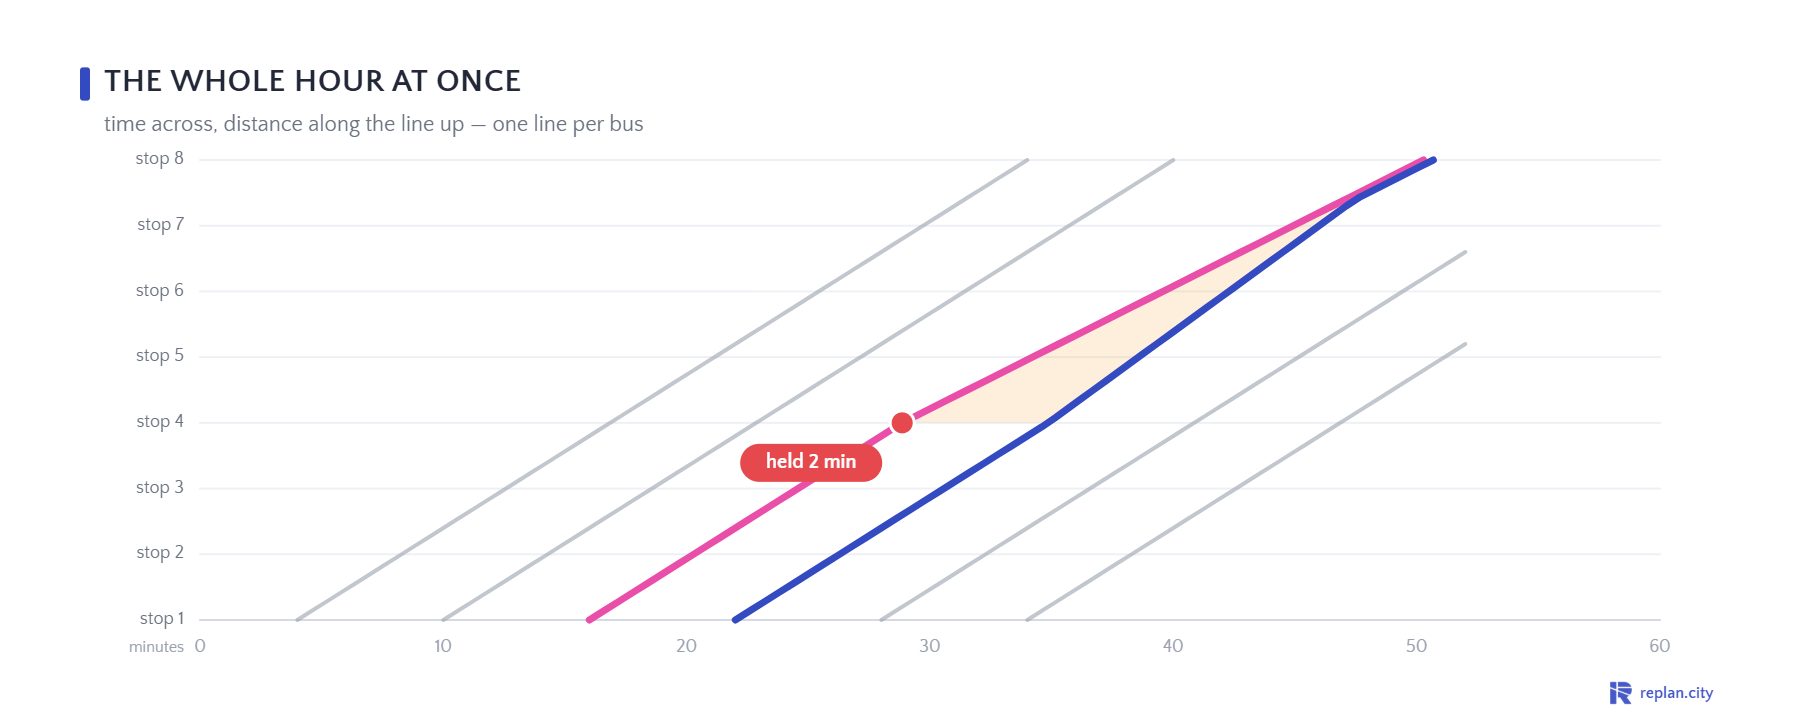
Bus bunching: why buses arrive in pairs
A late bus collects more passengers and gets later; the bus behind gets emptier and faster — until they run together.
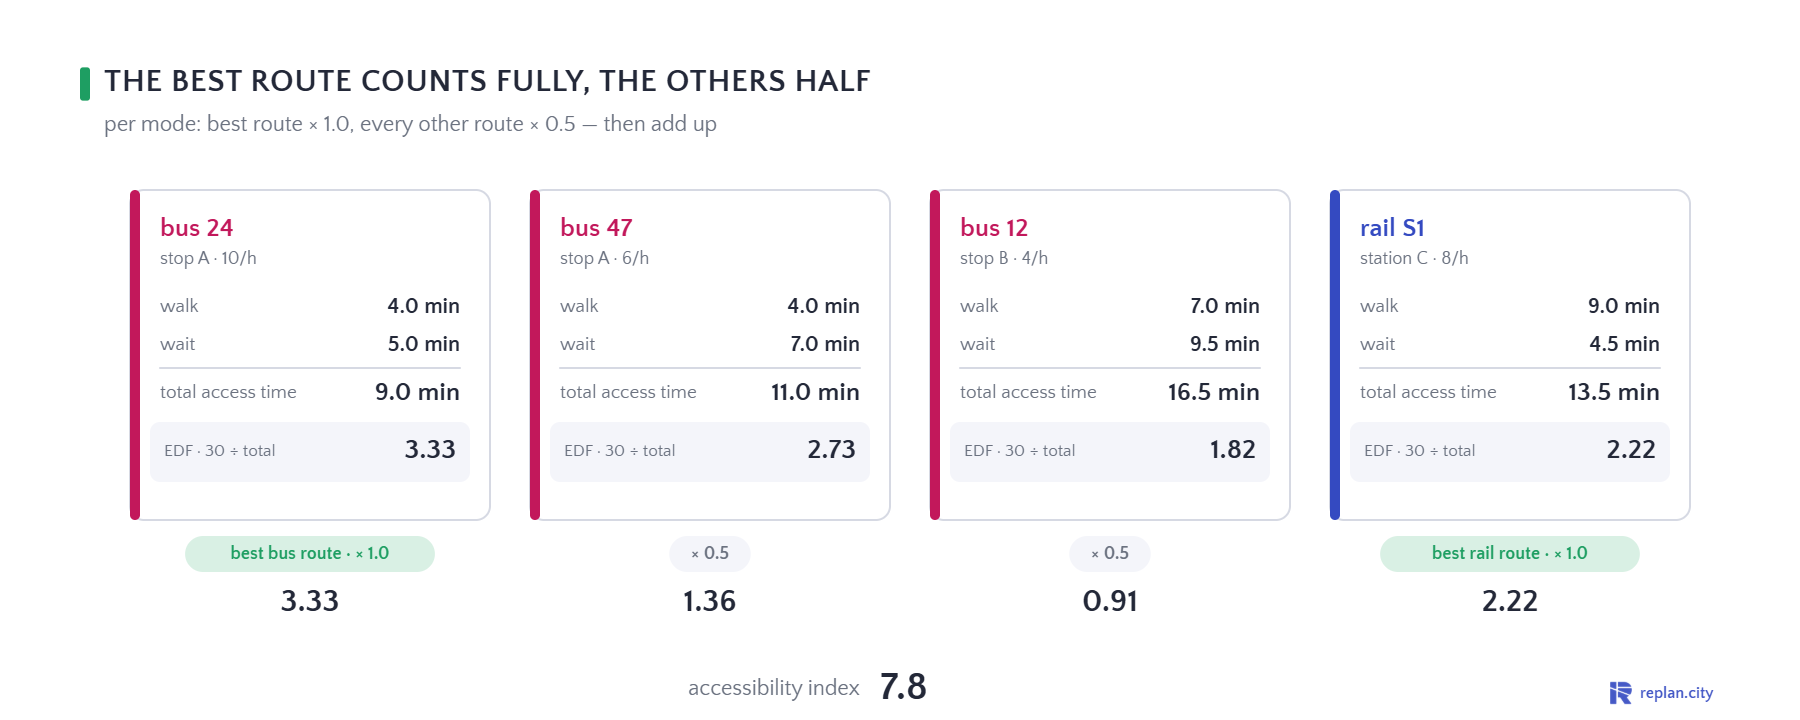
PTAL: how a point’s public transport access level is calculated
Walk to every stop within reach, add the scheduled wait, turn each route into an equivalent doorstep frequency, weight and sum.
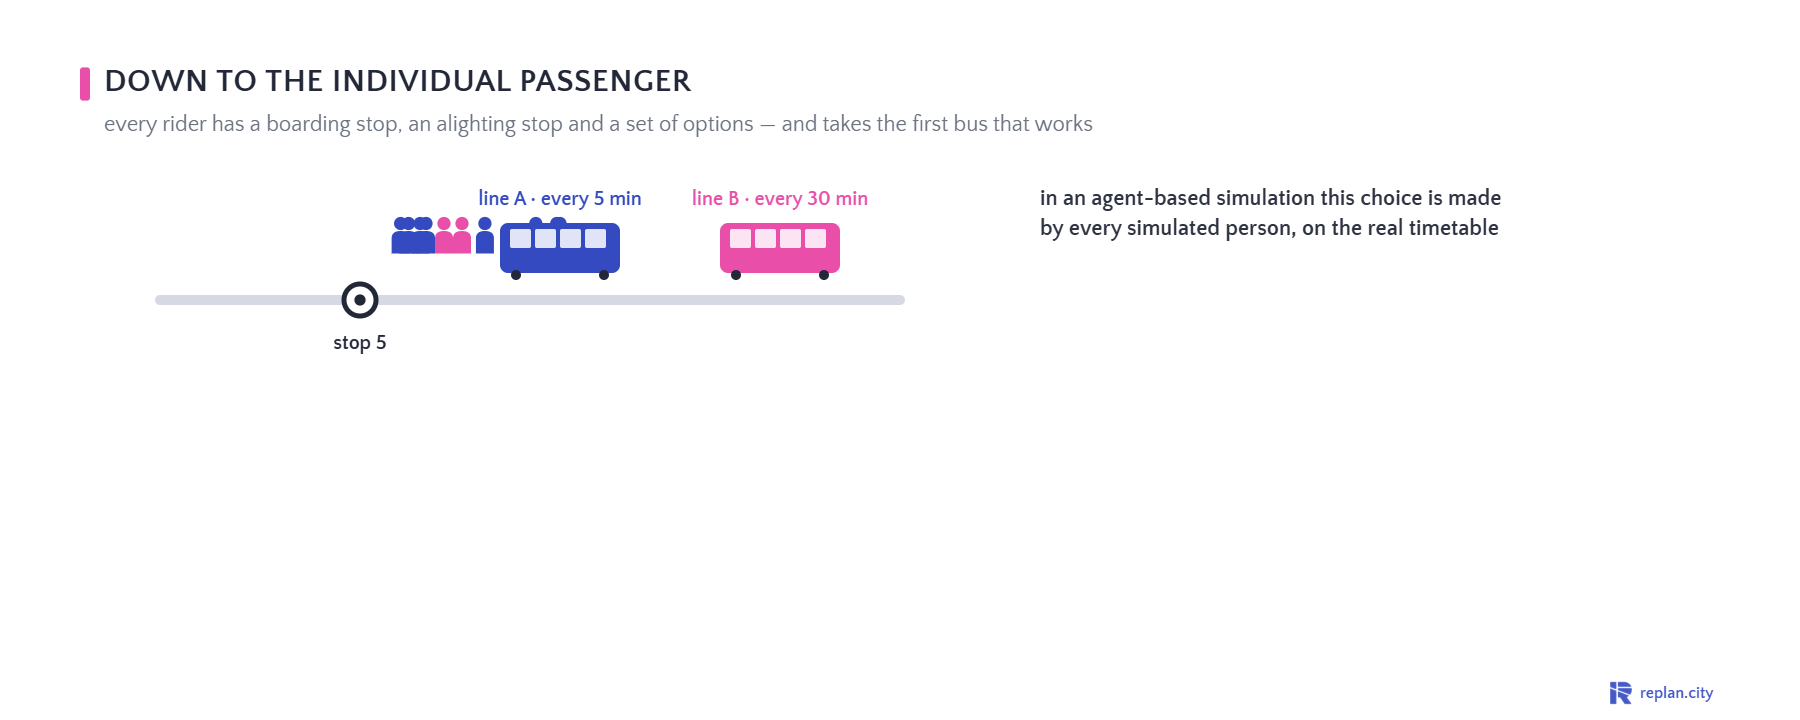
Line duplication: what it costs, what it gives, how to measure it
Overlap is the normal state of a bus network. Before removing it, measure it by connection and by frequency — down to the individual rider.
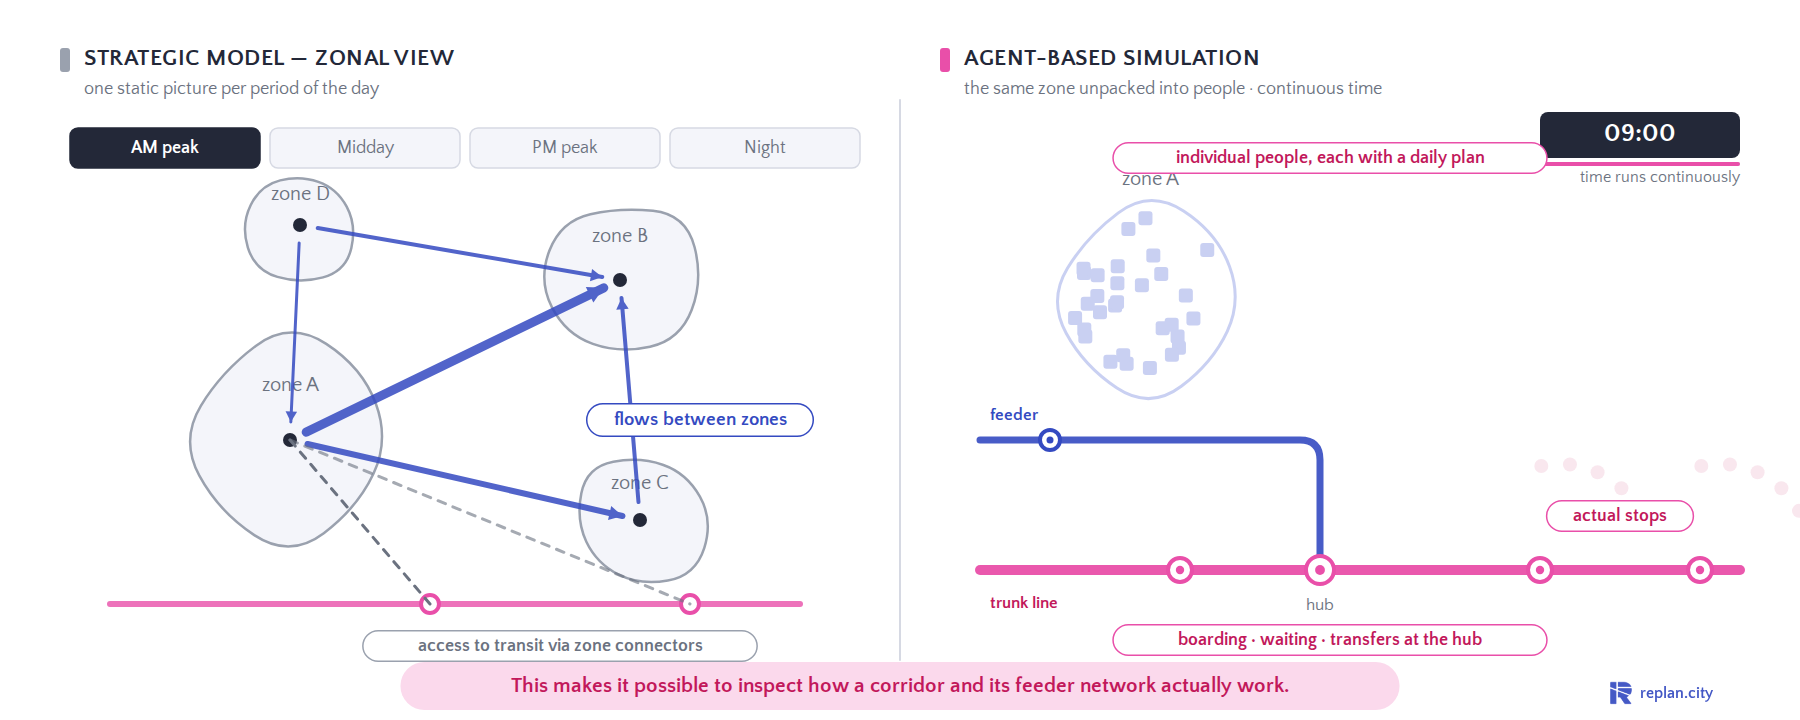
From zonal flows to individual journeys
This makes it possible to inspect how a corridor and its feeder network actually work.
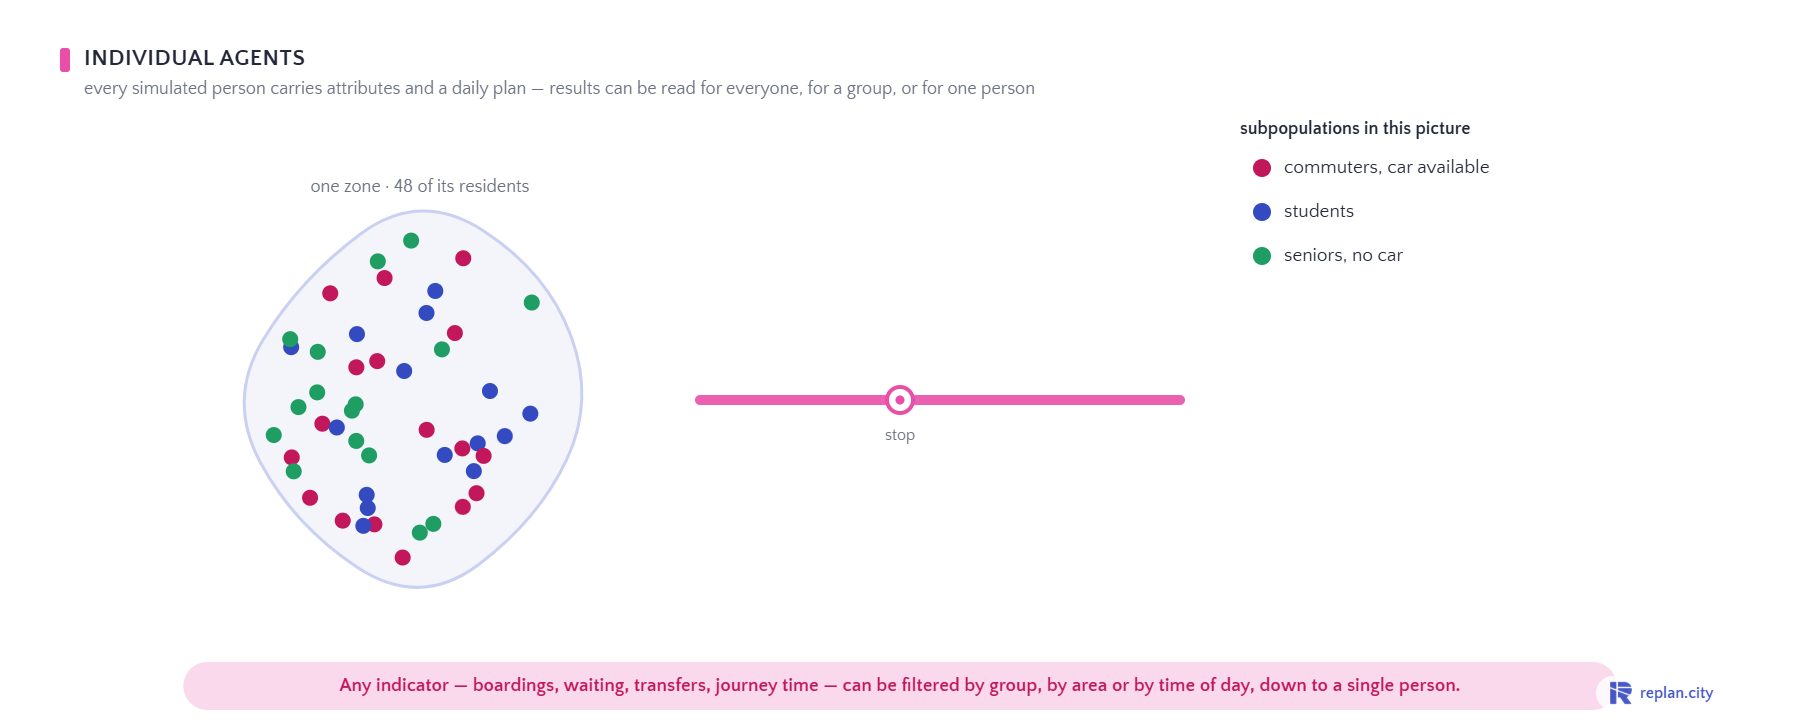
Individual agents: groups and single persons
Any indicator can be filtered by group, by area or by time of day, down to a single person.
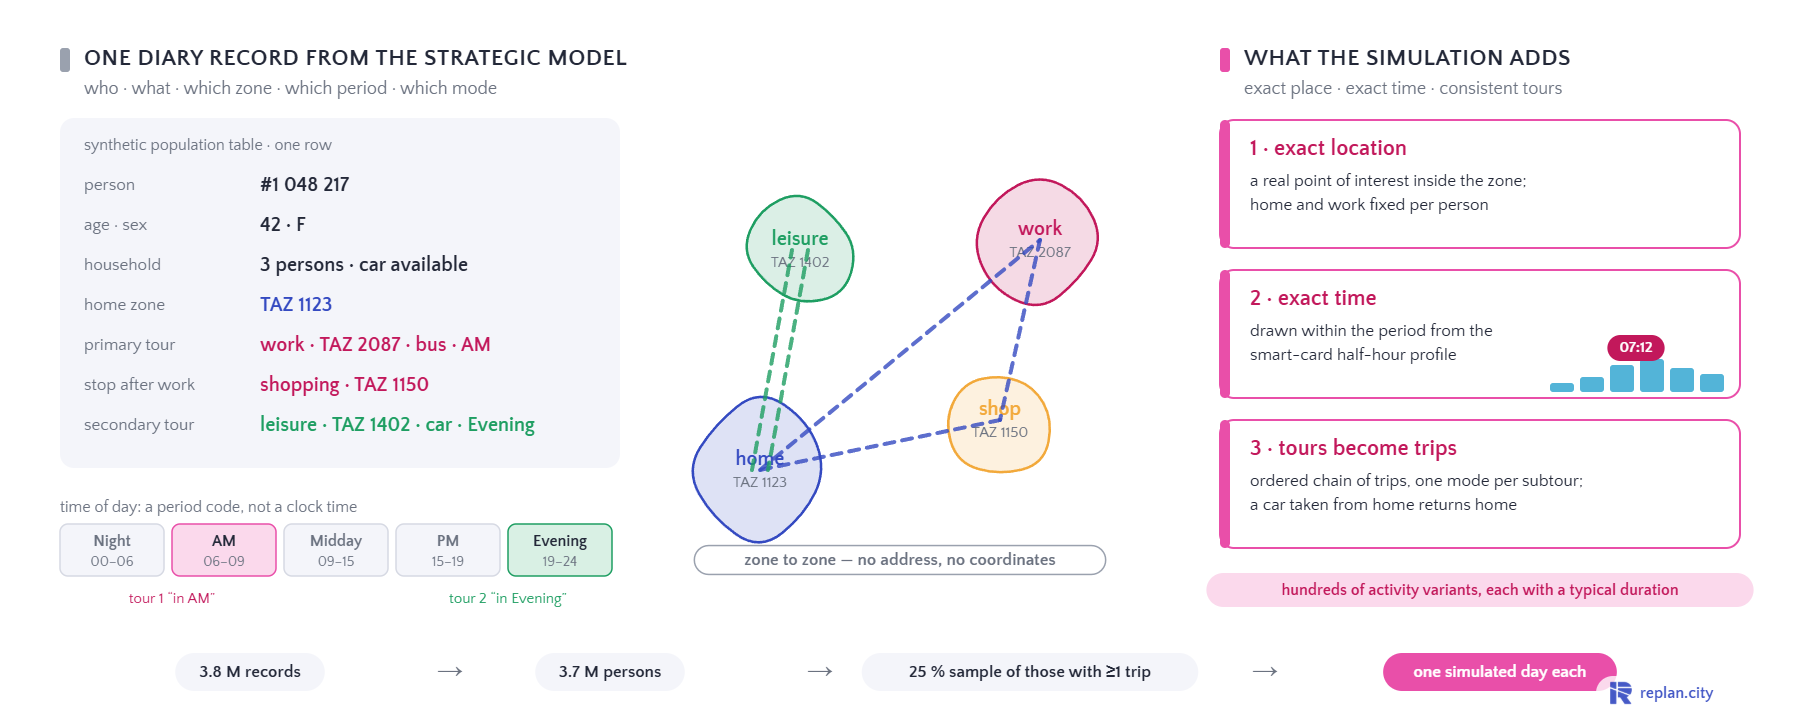
From a diary record to a simulated day
The strategic model supplies who, what, which zone and which period; the simulation adds exact place, exact time and consistent tours.
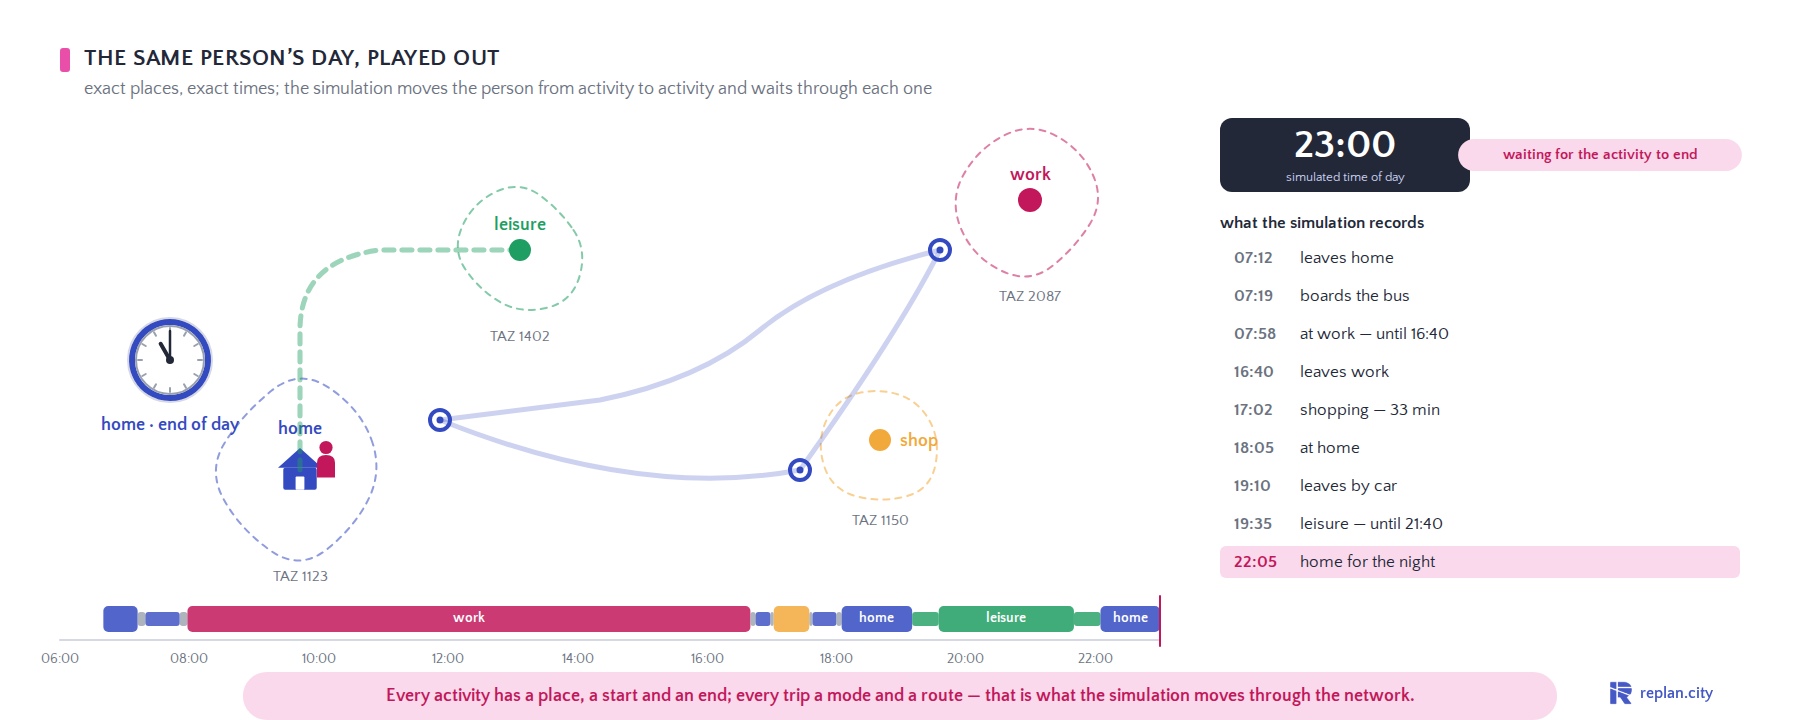
The same person’s day, played out
Every activity has a place, a start and an end; every trip a mode and a route — that is what the simulation moves through the network.
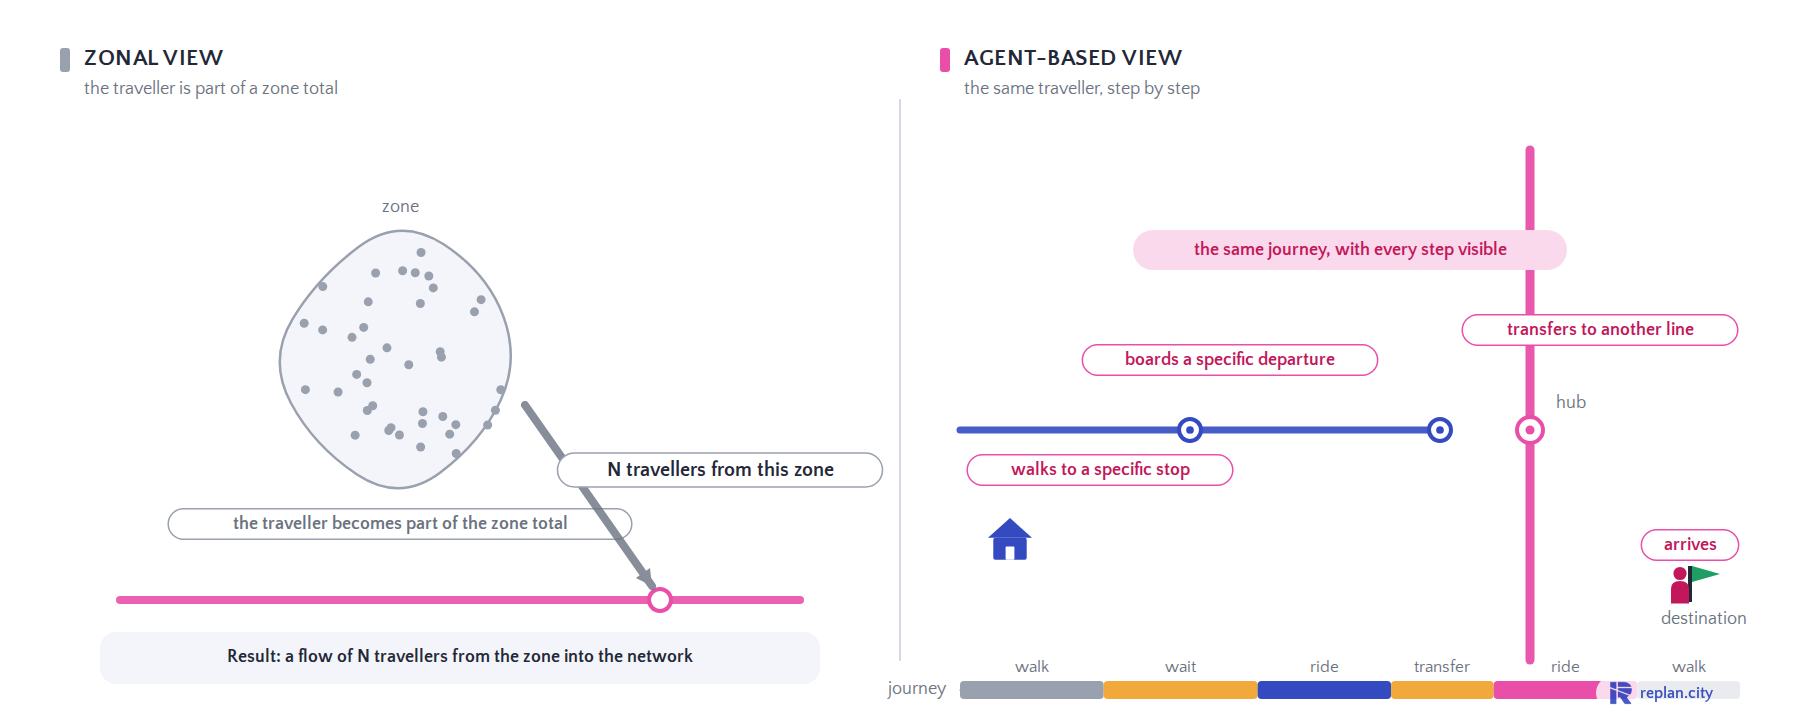
One traveller, two modelling views
Not a different answer to the strategic question — a visible journey behind the total.
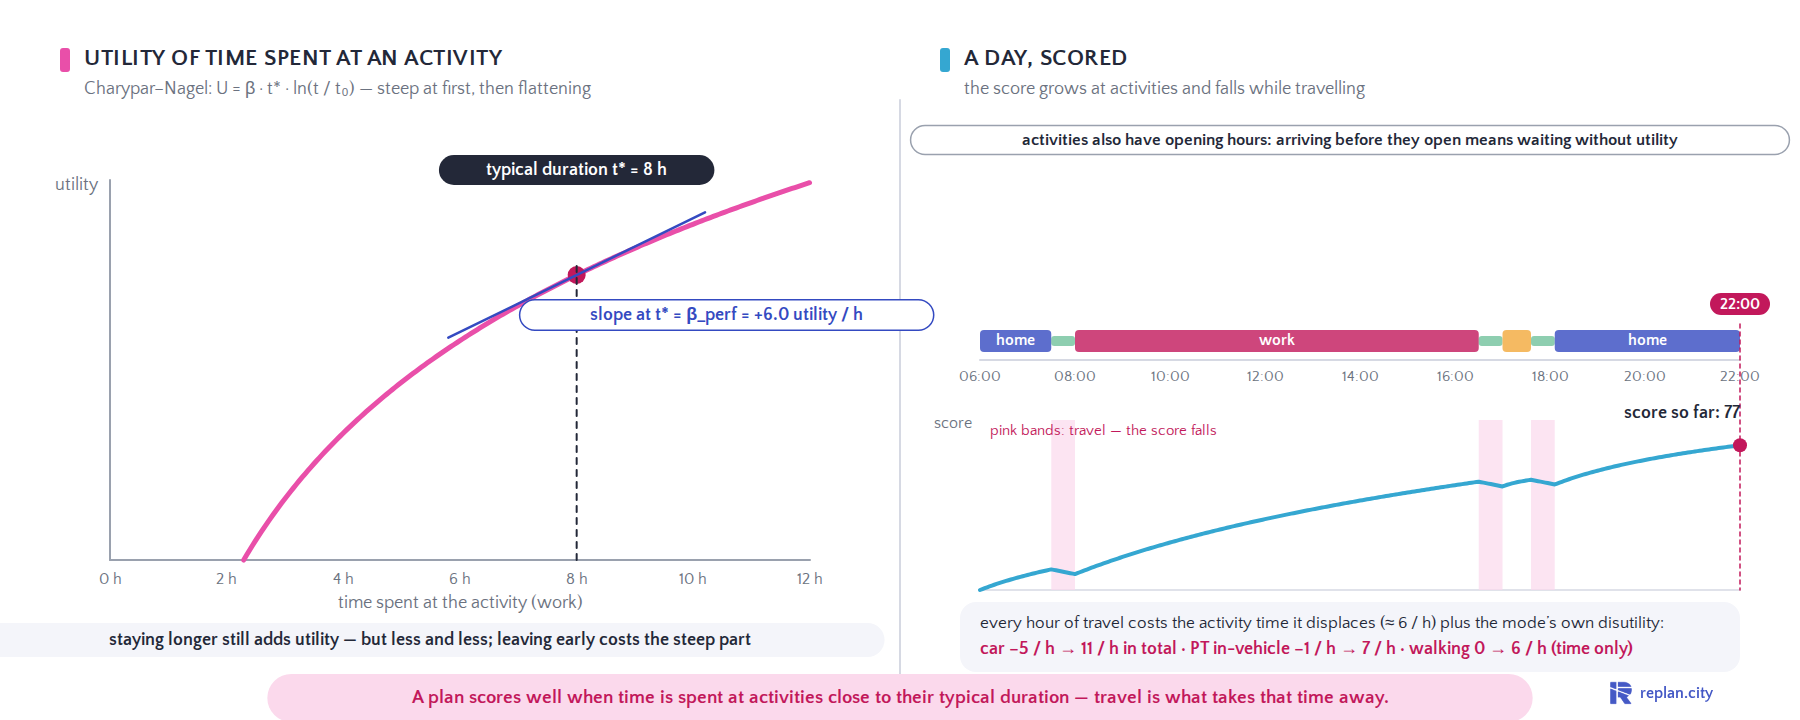
Charypar–Nagel: how an agent values time at an activity
A plan scores well when time is spent at activities close to their typical duration — travel is what takes that time away.
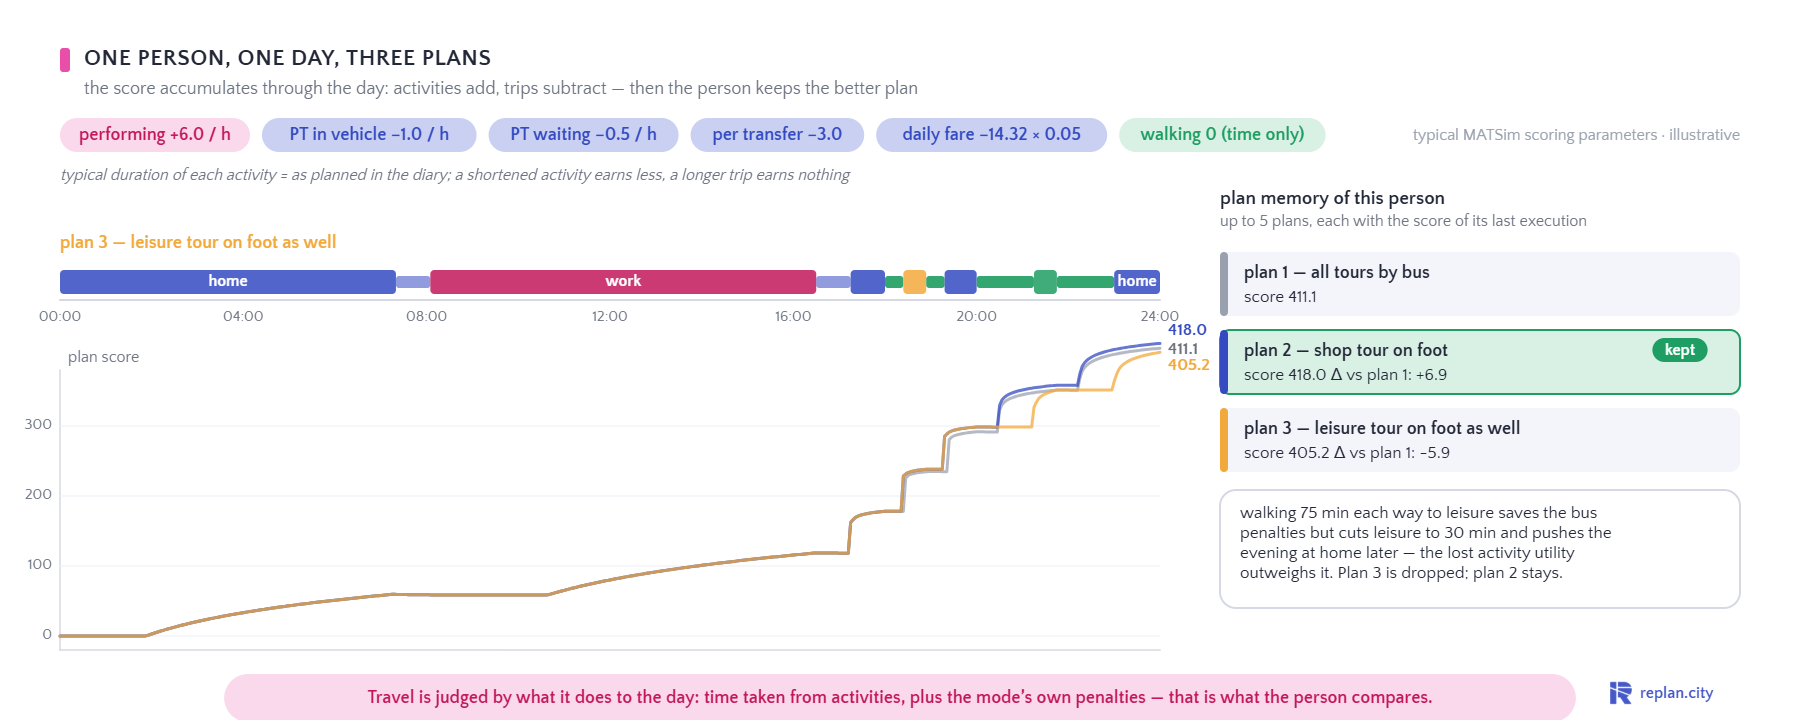
The scoring function at work
Travel is judged by what it does to the day — that is what the person compares.
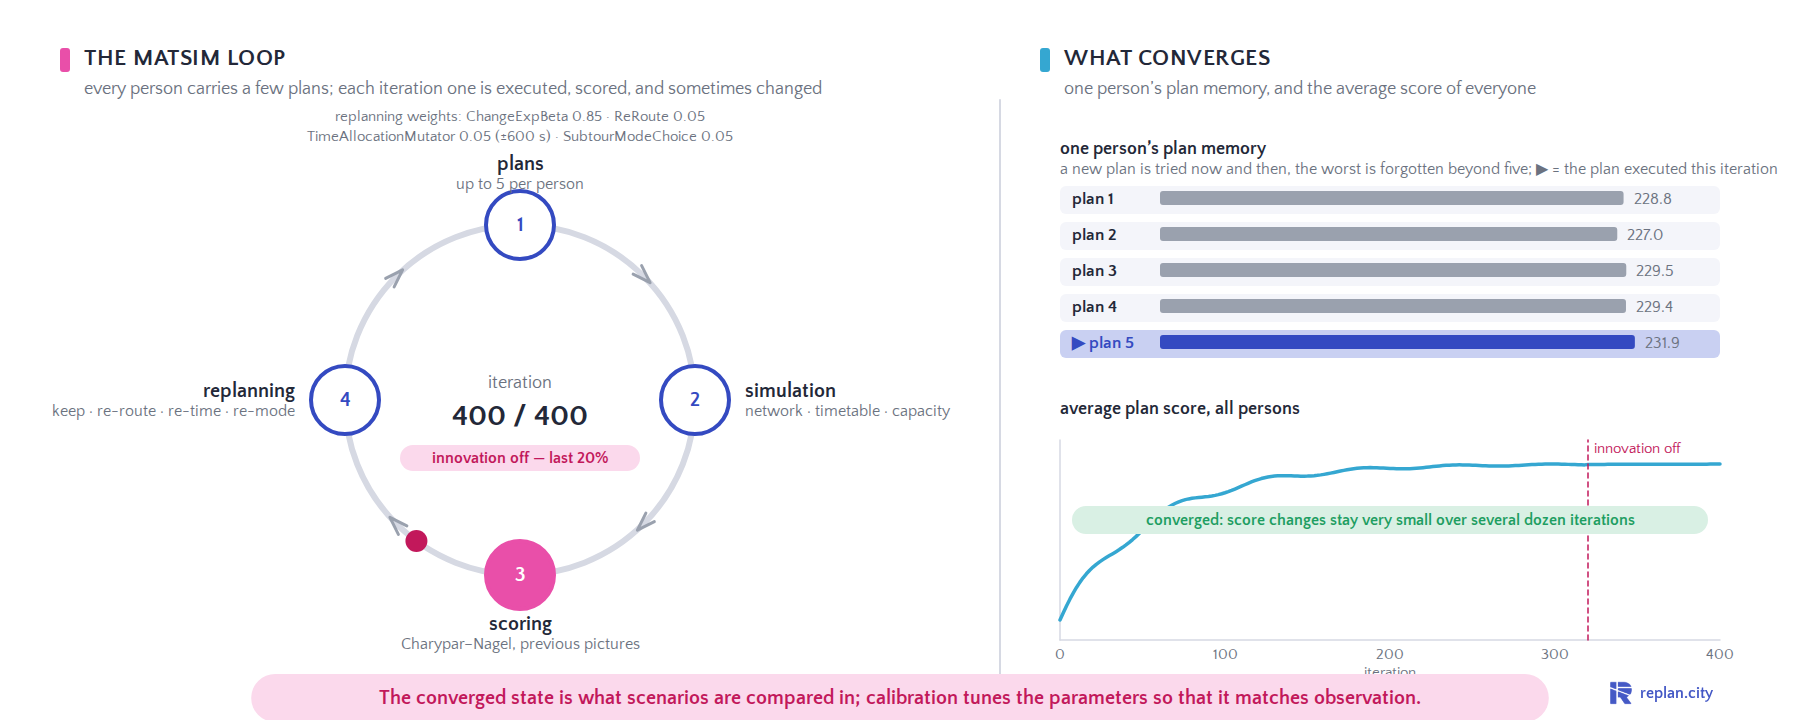
The MATSim loop
The converged state is what scenarios are compared in; calibration tunes the parameters so that it matches observation.
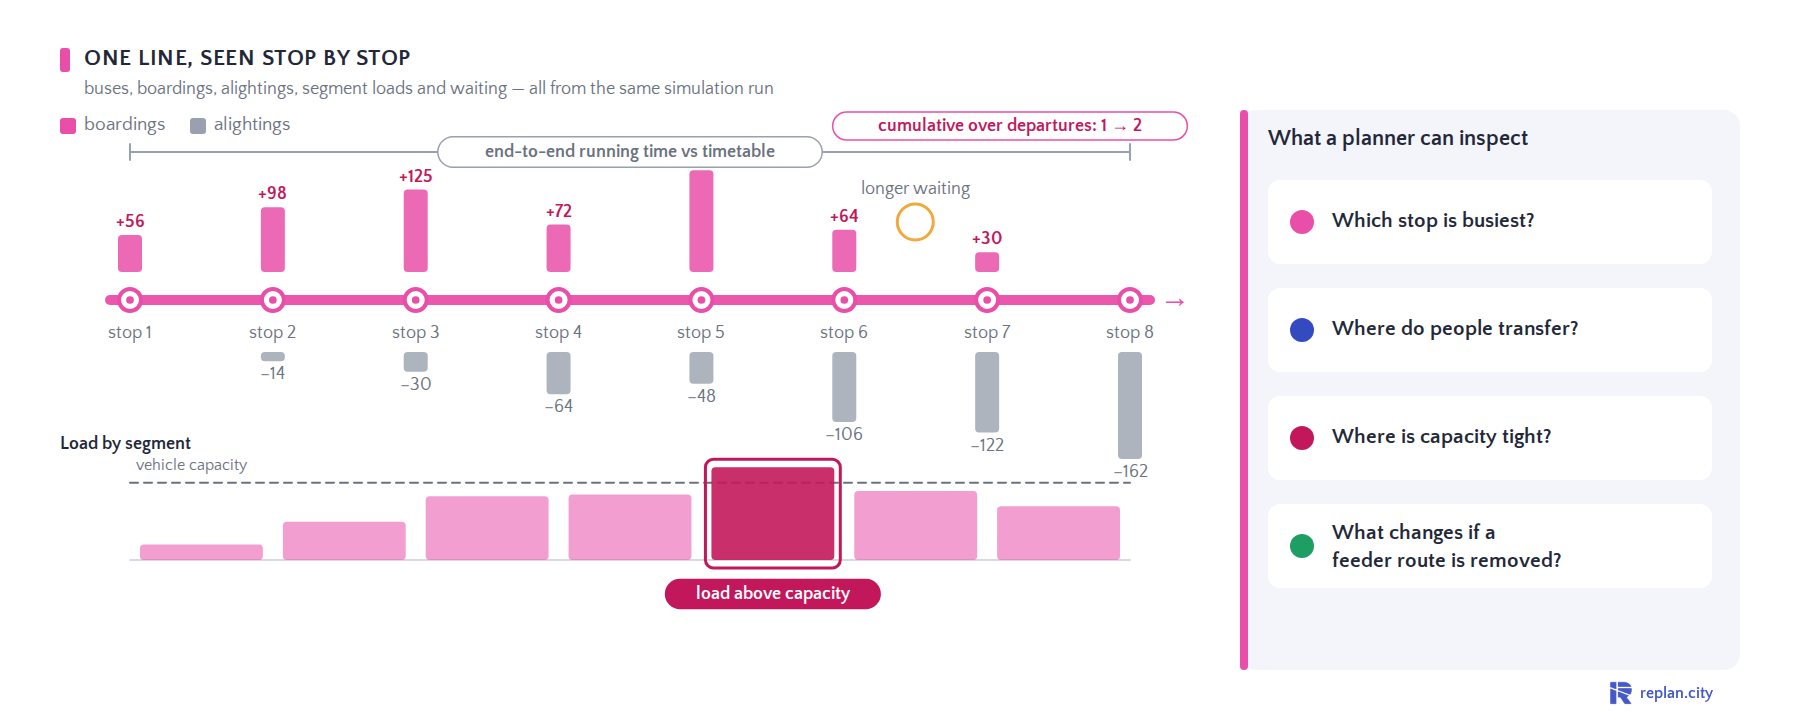
Looking inside the line, not only at total demand
Buses, boardings, alightings, segment loads and waiting — all from the same simulation run.
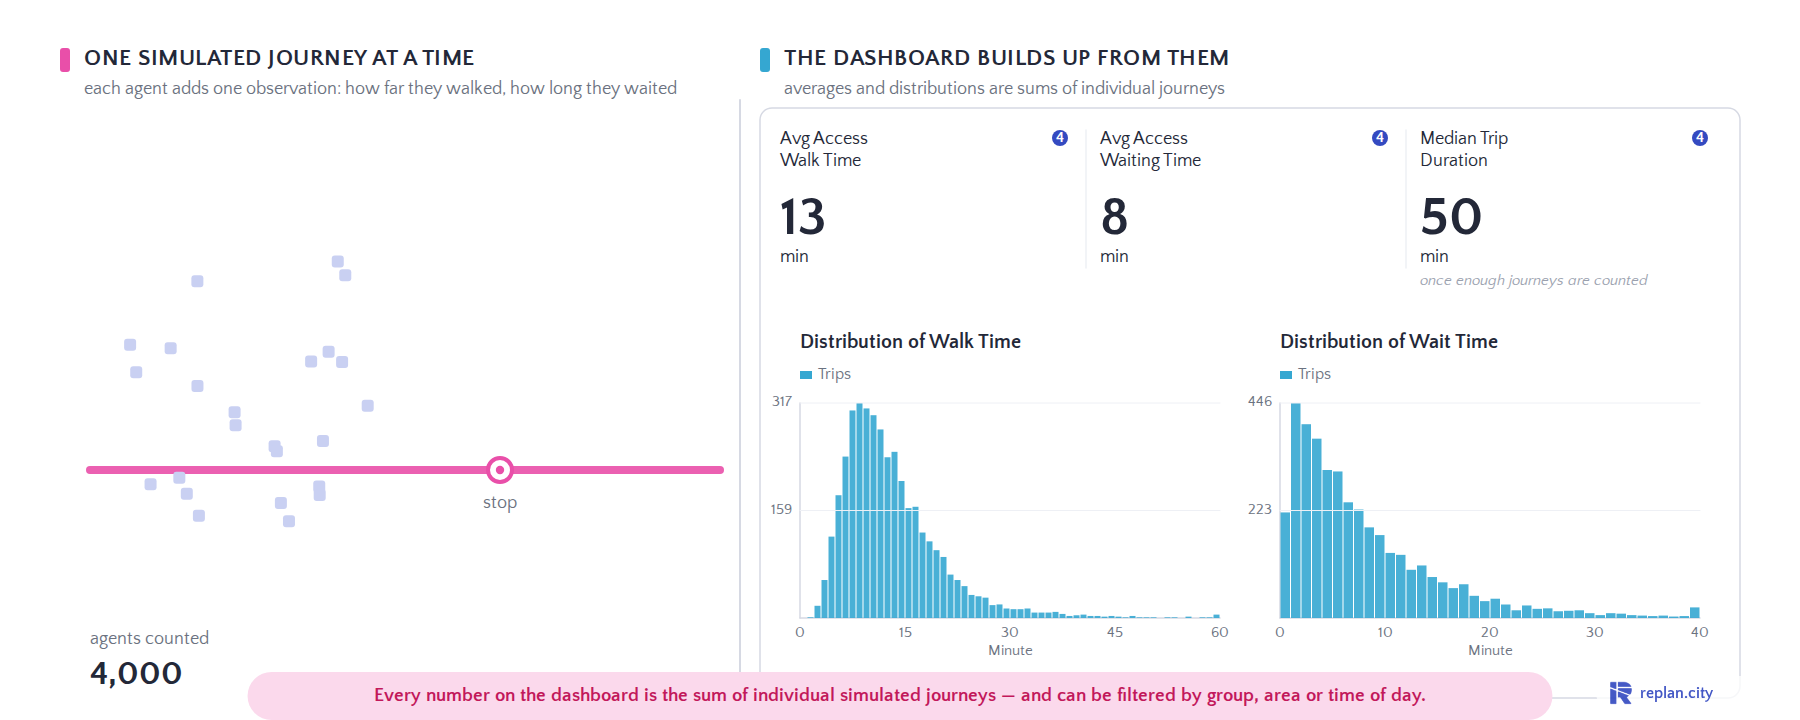
From individual journeys to dashboard statistics
Every number on the dashboard is the sum of individual simulated journeys — and can be filtered by group, area or time of day.
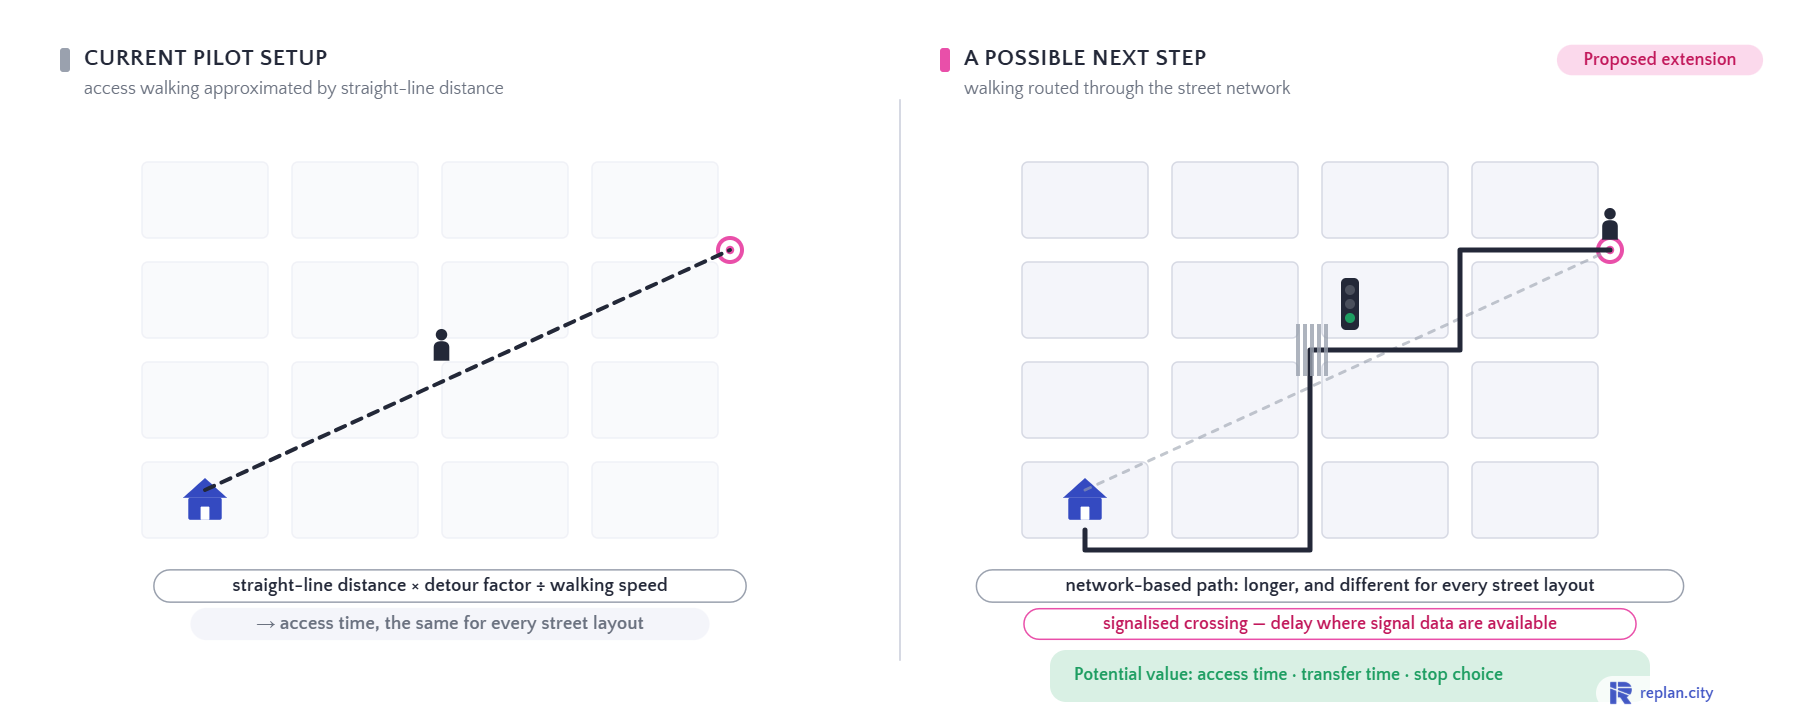
From straight-line walking to network-based walking
Potential value: access time, transfer time, stop choice.
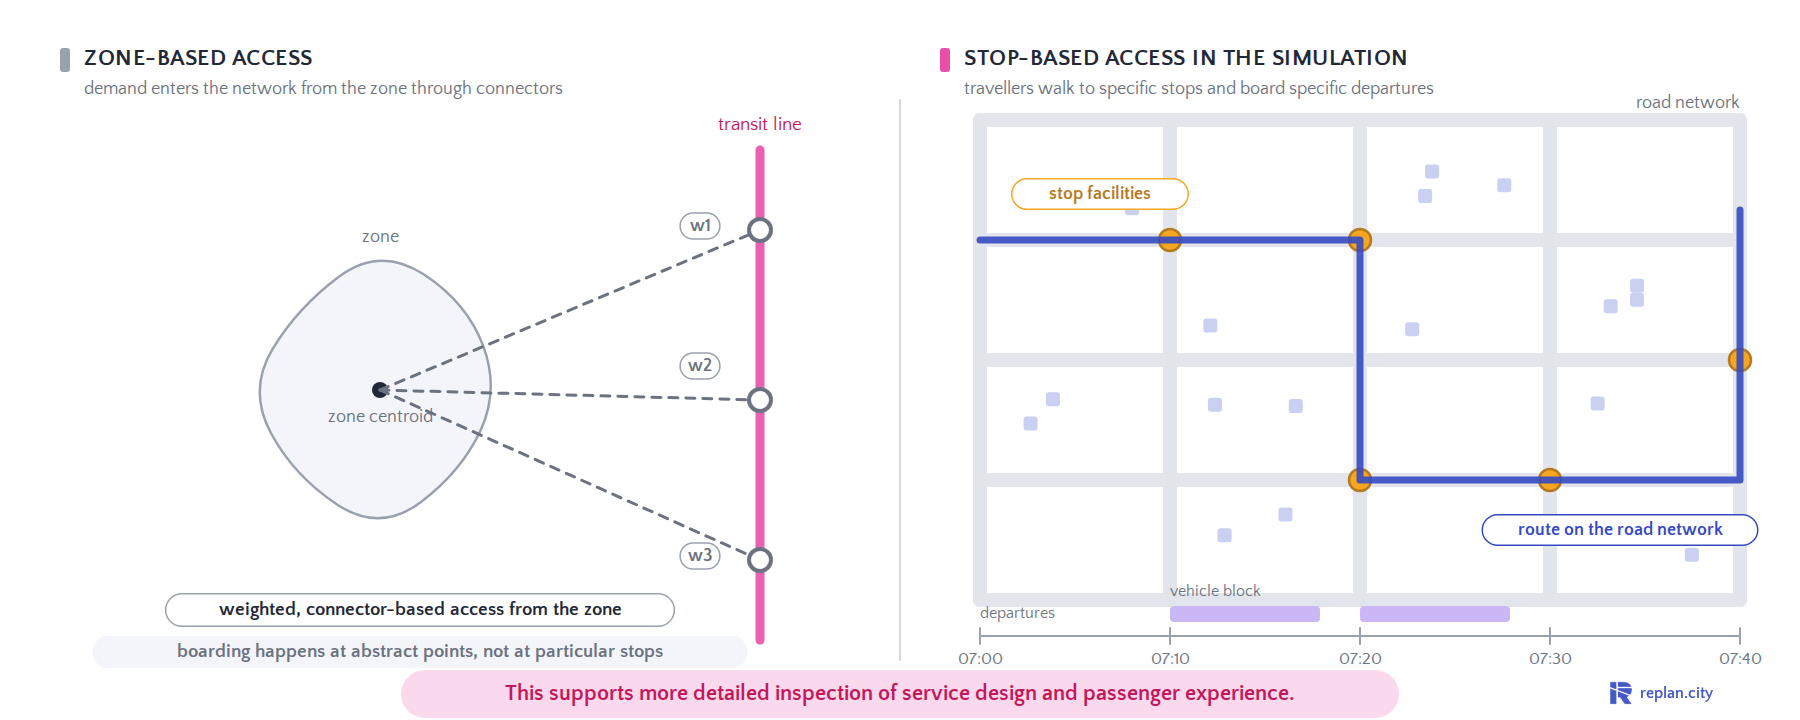
Two different ways to connect travellers to transit
This supports more detailed inspection of service design and passenger experience.
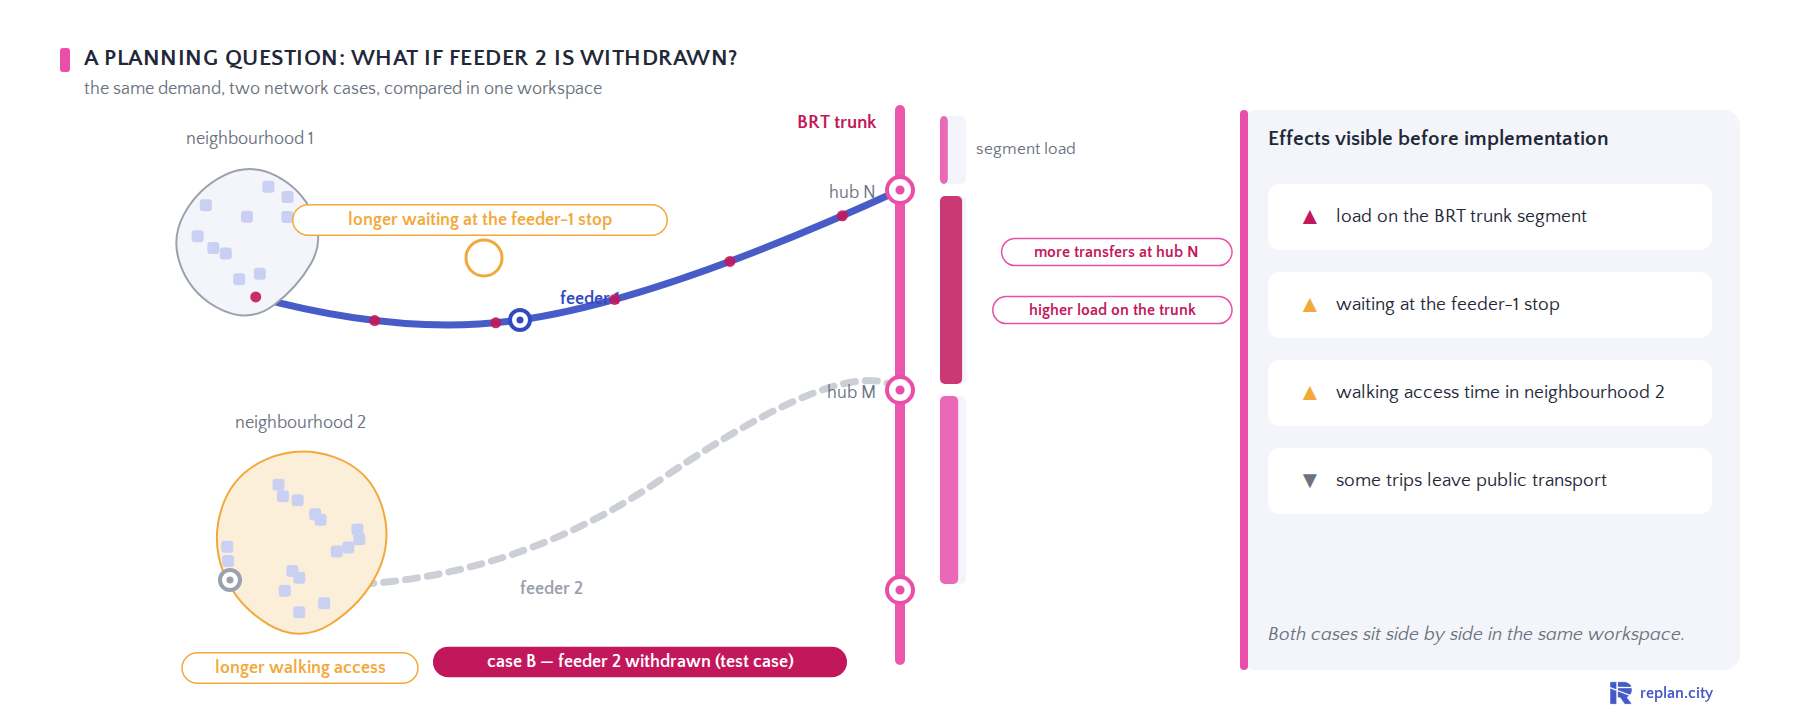
Testing a feeder change before implementation
Both cases sit side by side in the same workspace.
Product walk-throughs — the first hour, drawing a line, scheduling, network alternatives — are in Replan Academy →
Open the AcademyMissing a concept? Tell us what to explain next →
sales@replan.city